Search results for tag #education
![[?]](https://cdn.masto.host/zirkus/accounts/avatars/109/363/471/129/904/593/original/366278842762c266.png)
Calls for increased financial literacy subtly undermine a key attribute of many mainstream model of 'rational' economics.
If consumers need to learn how markets work, to understand what in their best interests, then the notion that markets reflect 'natural' human rationality cannot be right, otherwise no learning would be needed... which emphasises markets are social construct requiring inculcation!
(I should add that I think increased financial literacy is a good idea)
![[?]](https://gs.leftic.club/system/accounts/avatars/111/077/014/684/293/734/original/78fc4800646ad7cf.png)
Mouvement « GenZ212 » : quand la jeunesse marocaine prend ses propres affaires en main
https://www.contretemps.eu/maroc-mouvement-genz212-soulevement-jeunesse/
#Politique #Conjoncture #Diaporama #Enquête #AutoOrganisation #Contestation #Éducation #Jeunesse #Maroc #MobilisationsCollectives #MouvementSocial #Pouvoir #Santé #SolidaritéInternationaliste
![[?]](https://s3-eu-central-1.amazonaws.com/mastodon-aral/accounts/avatars/000/000/001/original/0d9c2e06a0f43906.png)
Nadeen and her sister need $2,000 to pay their tuition fees to continue studying.
If anyone wants to sponsor their education, this is your chance to gift our world two young dentists.
💕
#Gaza #Palestine #FediAid #mutualAid #education #academia #dentistry #sponsorships #FreePalestine https://mastodon.social/@Dr_Nadeen98/115323017767658305
![[?]](https://cdn.toad.social/accounts/avatars/109/445/054/979/275/176/original/f4cd3985267c0654.jpg)

"It's easier, really, to believe in a cabal of satanic pedophiles running the government than to worry that your kid’s youth pastor might be a predator.”
~ Ibid.
#evangelicals #WhiteChristianNationalism #SexualAbuse #LGBTQ #trans #education #schools
/3
“The Christian Right has set up a parallel universe of homeschool curricula and legal defense groups that fundraise off fear—fear of gays, fear of trans people, fear of the Marxist dictatorships of social studies teachers in small-town America—and use the funds to enrich the coffers of churches that oftentimes are busy concealing sex abuse scandals of their own."
~ Ibid., p. 44
#evangelicals #WhiteChristianNationalism #SexualAbuse #LGBTQ #trans #education
/2
![[?]](https://files.hear-me.social/accounts/avatars/110/663/286/708/241/385/original/eb5ae4c05819f336.jpg)
I took some comfort from this message for new college graduates, printed 51 years ago.
New York Times, June 1974:
"Nothing has been settled, but everything is under discussion. All human relationships between men and women, between the big powers and the small powers, within the family, the university and the church are being analyzed and disputed.... Where are you going and who's going with you? The devilish thing is not that they have no choices, but that they have so many choices."
![[?]](https://files.mastodon.social/accounts/avatars/113/635/103/853/964/473/original/0a4435eaf8d5c473.png)
![[?]](https://soc.octade.net/octade/s/3f7f2b5eda4e392867c301c49c2daa16.png)
"If you want to sell someone something, you first have to convince them that they need it. This rationalization is the likely source of a fundamental myth of the American public school system: that before the proliferation of compulsory, tax-payer funded schooling, Americans were ignorant and mostly illiterate."
"Authority will always try to convince you how helpless and bereft you would be without the authority. Americans were neither illiterate nor ignorant before forced schooling. Compulsory, tax-payer funded education has not been an overall improvement for the population, despite the billions of dollars and wasted hours spent on it. To claim Americans need government schools to learn is a grab for power and control, and ignores centuries’ worth of data and lived experience."https://renegadeeducator.com/the-american-myth-of-illiteracy-how-education-worked-before-taxpayer-funded-schooling/
The critical window of shadow libraries (2024) https://lobste.rs/s/gid0gu #education
https://annas-archive.org/blog/critical-window.html
![[?]](https://files.defcon.social/dcsocial-s3/accounts/avatars/113/208/344/507/078/943/original/014820ad22daee1c.jpg)
2025 October 10
50 Light-years to 51 Pegasi
* Image Credit & Copyright: José Rodrigues
https://joserodrigues.space/
Explanation:
It's only 50 light-years to 51 Pegasi. That star's position is indicated in this snapshot from August 2025, taken on a night with mostly brighter stars visible above the dome at Observatoire de Haute-Provence in France. Thirty years ago, in October of 1995, astronomers Michel Mayor and Didier Queloz announced a profound discovery made at the observatory. Using a precise spectrograph they had detected a planet orbiting 51 Peg, the first known exoplanet orbiting a sun-like star. Mayor and Queloz had used the spectrograph to measure changes in the star's radial velocity, a regular wobble caused by the gravitational tug of the orbiting planet. Designated 51 Pegasi b, the planet was determined to have a mass at least half of Jupiter's mass and an orbital period of 4.2 days. That made the exoplanet much closer to its parent star than Mercury is to the Sun. Their discovery was quickly confirmed and Mayor and Queloz were ultimately awarded the Nobel Prize in physics in 2019. Now recognized as the prototype for the class of exoplanets fondly known as hot Jupiters, 51 Pegasi b was formally named Dimidium, Latin for half, in 2015. Since its discovery 30 years ago, over 6,000 exoplanets have been found.
https://ui.adsabs.harvard.edu/abs/1995Natur.378..355M/abstract
https://www.planetary.org/articles/color-shifting-stars-the-radial-velocity-method
https://arxiv.org/abs/1801.06117
https://earthsky.org/space/this-date-in-science-first-planet-discovered-around-sunlike-star/
3D (INTERACTIVE):
https://eyes.nasa.gov/apps/exo/#/planet/51_Peg_b
https://apod.nasa.gov/apod/ap251010.html
#space #exoplanets #astrophotography #photography #science #astronomy #tech #NASA #ESA #education #apod
 & Jerry Bonnell (UMCP)
NASA Official: Amber Straughn Specific rights apply.")
Alt...
2025 October 10
50 Light-years to 51 Pegasi
* Image Credit & Copyright: José Rodrigues
Explanation:
It's only 50 light-years to 51 Pegasi. That star's position is indicated in this snapshot from August 2025, taken on a night with mostly brighter stars visible above the dome at Observatoire de Haute-Provence in France. Thirty years ago, in October of 1995, astronomers Michel Mayor and Didier Queloz announced a profound discovery made at the observatory. Using a precise spectrograph they had detected a planet orbiting 51 Peg, the first known exoplanet orbiting a sun-like star. Mayor and Queloz had used the spectrograph to measure changes in the star's radial velocity, a regular wobble caused by the gravitational tug of the orbiting planet. Designated 51 Pegasi b, the planet was determined to have a mass at least half of Jupiter's mass and an orbital period of 4.2 days. That made the exoplanet much closer to its parent star than Mercury is to the Sun. Their discovery was quickly confirmed and Mayor and Queloz were ultimately awarded the Nobel Prize in physics in 2019. Now recognized as the prototype for the class of exoplanets fondly known as hot Jupiters, 51 Pegasi b was formally named Dimidium, Latin for half, in 2015. Since its discovery 30 years ago, over 6,000 exoplanets have been found.
Authors & editors: Robert Nemiroff (MTU) & Jerry Bonnell (UMCP)
NASA Official: Amber Straughn Specific rights apply.
2025 October 8
NGC 7380: The Wizard Nebula
* Images Credit & Copyright: Nevenka Blagovic Horvat & Miroslav Horvat
https://www.instagram.com/miroslav.horvat/
https://www.flickr.com/people/miroslav1/
Explanation:
What powers are being wielded in the Wizard Nebula? Gravitation strong enough to form stars, and stellar winds and radiations powerful enough to create and dissolve towers of gas. Located only 8,000 light years away, the Wizard nebula, featured here, surrounds developing open star cluster NGC 7380. Visually, the interplay of stars, gas, and dust has created a shape that appears to some like a fictional medieval sorcerer. The active star forming region spans about 100 light years, making it appear larger than the angular extent of the Moon. The Wizard Nebula can be located with a small telescope toward the constellation of the King of Aethiopia (Cepheus). Although the nebula may last only a few million years, some of the stars being formed may outlive our Sun.
https://en.wikipedia.org/wiki/Magician_(fantasy)#/media/File:Saluzzo-Castello_della_Manta-mago.jpg
https://en.wikipedia.org/wiki/NGC_7380
https://ui.adsabs.harvard.edu/abs/2011AJ....142...71C/abstract
https://ui.adsabs.harvard.edu/abs/2011AJ....142...71C/abstract
https://lco.global/spacebook/sky/using-angles-describe-positions-and-apparent-sizes-objects/
https://apod.nasa.gov/apod/ap251008.html
#space #nebula #cluster #astrophotography #photography #science #astronomy #nature #NASA #ESA #apod #education
. Although the nebula may last only a few million years, some of the stars being formed may outlive our Sun.
Authors & editors: Robert Nemiroff (MTU) & Jerry Bonnell (UMCP)
NASA Official: Amber Straughn Specific rights apply.
NASA Web Privacy, Accessibility, Notices;
A service of: ASD at NASA / GSFC,
NASA Science Activation
& Michigan Tech. U.")
Alt...
2025 October 8
A starfield is shown surrounding a bright gaseous nebula in red with bits of white and blue. Pillars of dust and gas appear around the interior of the nebula pointing to energetic stars in a cluster in the nebula. Please see the explanation for more detailed information.
NGC 7380: The Wizard Nebula
* Images Credit & Copyright: Nevenka Blagovic Horvat & Miroslav Horvat
Explanation:
What powers are being wielded in the Wizard Nebula? Gravitation strong enough to form stars, and stellar winds and radiations powerful enough to create and dissolve towers of gas. Located only 8,000 light years away, the Wizard nebula, featured here, surrounds developing open star cluster NGC 7380. Visually, the interplay of stars, gas, and dust has created a shape that appears to some like a fictional medieval sorcerer. The active star forming region spans about 100 light years, making it appear larger than the angular extent of the Moon. The Wizard Nebula can be located with a small telescope toward the constellation of the King of Aethiopia (Cepheus). Although the nebula may last only a few million years, some of the stars being formed may outlive our Sun.
Authors & editors: Robert Nemiroff (MTU) & Jerry Bonnell (UMCP)
NASA Official: Amber Straughn Specific rights apply.
NASA Web Privacy, Accessibility, Notices;
A service of: ASD at NASA / GSFC,
NASA Science Activation
& Michigan Tech. U.
How to Discover the Binary System as a Child https://lobste.rs/s/id2sr5 #video #education #math
https://www.youtube.com/watch?v=lg0RYLlmjJM
2025 October 7
SN Encore: A Second Supernova Seen Several Times
* Images Credit:
+ Webb (main): NASA, ESA, CSA, STScI, J. Pierel (STScI) & A. Newman (Carnegie Inst. for Science)
https://science.nasa.gov/mission/webb/
https://www.esa.int/
https://www.asc-csa.gc.ca/
https://www.stsci.edu/
https://www.linkedin.com/in/justinr3
https://carnegiescience.edu/bio/dr-andrew-newman
https://carnegiescience.edu/
+ Hubble (rollover): NASA, ESA, STScI, S. A. Rodney (U. South Carolina) & G. Brammer (NBI, U. Copenhagen)
https://science.nasa.gov/mission/hubble/
https://sc.edu/uofsc/posts/2018/08/garnet_apple_steven_rodney.php
https://sc.edu/study/colleges_schools/artsandsciences/physics_and_astronomy/
https://nbi.ku.dk/english/staff/?pure=en/persons/625553
https://nbi.ku.dk/
Explanation:
Now a second supernova in this same galaxy is repeating. The cause is the gravitational lens effect of a massive foreground cluster of galaxies (MACS J0138) -- it creates multiple images of a perfectly aligned background galaxy (MRG-M0138). What's particularly interesting is that this background galaxy has young stars that keep blowing up. And images of each supernova explosion keep coming to us multiple times through different paths through the cluster. The original lensed supernova set, shown in the rollover, is called Requiem and was first seen by the Hubble Space Telescope in 2016. This second lensed supernova set is called Encore and was first seen by the Webb Space Telescope in 2023. More images from these supernovas are predicted to be on the way, and exactly when they arrive should help humanity to better understand the mass distribution of the galaxy cluster, the supernovas themselves, and possibly even the universe.
https://www.flickr.com/photos/nasawebbtelescope/53412181911/in/album-72177720305127361
https://science.nasa.gov/blogs/webb/2024/10/01/webb-researchers-discover-lensed-supernova-confirm-hubble-tension/
https://science.nasa.gov/asset/webb/gravitational-lensing/
https://spaceplace.nasa.gov/supernova/en/
https://apod.nasa.gov/apod/ap251007.html
#space #galaxy #astrophotography #photography #science #physics #nature #NASA #ESA #hubble #webb #education #apod
: NASA, ESA, CSA, STScI, J. Pierel (STScI) & A. Newman (Carnegie Inst. for Science)
+ Hubble (rollover): NASA, ESA, STScI, S. A. Rodney (U. South Carolina) & G. Brammer (NBI, U. Copenhagen)
Explanation:
Now a second supernova in this same galaxy is repeating. The cause is the gravitational lens effect of a massive foreground cluster of galaxies (MACS J0138) -- it creates multiple images of a perfectly aligned background galaxy (MRG-M0138). What's particularly interesting is that this background galaxy has young stars that keep blowing up. And images of each supernova explosion keep coming to us multiple times through different paths through the cluster. The original lensed supernova set, shown in the rollover, is called Requiem and was first seen by the Hubble Space Telescope in 2016. This second lensed supernova set is called Encore and was first seen by the Webb Space Telescope in 2023. More images from these supernovas are predicted to be on the way, and exactly when they arrive should help humanity to better understand the mass distribution of the galaxy cluster, the supernovas themselves, and possibly even the universe.")
Alt...
2025 October 7
An image shows a cluster of galaxies with unusual arcs. The arcs are background galaxies distorted by the gravitational lens effect of the foreground cluster. The background galaxy shows several spots that are supernovas occurring in the galaxy.
SN Encore: A Second Supernova Seen Several Times
* Images Credit:
+ Webb (main): NASA, ESA, CSA, STScI, J. Pierel (STScI) & A. Newman (Carnegie Inst. for Science)
+ Hubble (rollover): NASA, ESA, STScI, S. A. Rodney (U. South Carolina) & G. Brammer (NBI, U. Copenhagen)
Explanation:
Now a second supernova in this same galaxy is repeating. The cause is the gravitational lens effect of a massive foreground cluster of galaxies (MACS J0138) -- it creates multiple images of a perfectly aligned background galaxy (MRG-M0138). What's particularly interesting is that this background galaxy has young stars that keep blowing up. And images of each supernova explosion keep coming to us multiple times through different paths through the cluster. The original lensed supernova set, shown in the rollover, is called Requiem and was first seen by the Hubble Space Telescope in 2016. This second lensed supernova set is called Encore and was first seen by the Webb Space Telescope in 2023. More images from these supernovas are predicted to be on the way, and exactly when they arrive should help humanity to better understand the mass distribution of the galaxy cluster, the supernovas themselves, and possibly even the universe.
 & Jerry Bonnell (UMCP)
NASA Official: Amber Straughn Specific rights apply.
NASA Web Privacy, Accessibility, Notices;
A service of: ASD at NASA / GSFC,
NASA Science Activation
& Michigan Tech. U.")
Alt...
RollOver
Image Hubble 2016
Authors & editors: Robert Nemiroff (MTU) & Jerry Bonnell (UMCP)
NASA Official: Amber Straughn Specific rights apply.
NASA Web Privacy, Accessibility, Notices;
A service of: ASD at NASA / GSFC,
NASA Science Activation
& Michigan Tech. U.
2025 October 6
The Changing Ion Tail of Comet Lemmon
* Images Credit & Copyright: Victor Sabet & Julien De Winter
https://www.instagram.com/dwj85
Explanation:
How does a comet tail change? It depends on the comet. The ion tail of Comet C/2025 A6 (Lemmon) has been changing markedly, as detailed in the featured image sequenced over six days between September 25 and October 3 (left to right) from Texas, USA. On some days, the comet's ion tail was relatively more complex than other days. Reasons for tail changes include the rate of ejection of material from the comet's nucleus, the strength and complexity of the passing solar wind, and the rotation rate of the comet. Sometimes, over the course of a week, apparent differences even result from a change of perspective from the Earth. In general, a comet's ion tail will point away from the Sun, as gas expelled is pushed out by the Sun's wind. Comet Lemmon is still inbound and brightening, passing nearest the Earth on October 21 and nearest the Sun on November 8.
https://theskylive.com/c2025a6-info
http://www2.ess.ucla.edu/~jewitt/tail.html
https://spaceplace.nasa.gov/comets/en/
https://apod.nasa.gov/apod/ap251006.html
#space #comets #astrophotography #photography #science #astronomy #nature #NASA #ESA #education
 has been changing markedly, as detailed in the featured image sequenced over six days between September 25 and October 3 (left to right) from Texas, USA. On some days, the comet's ion tail was relatively more complex than other days. Reasons for tail changes include the rate of ejection of material from the comet's nucleus, the strength and complexity of the passing solar wind, and the rotation rate of the comet. Sometimes, over the course of a week, apparent differences even result from a change of perspective from the Earth. In general, a comet's ion tail will point away from the Sun, as gas expelled is pushed out by the Sun's wind. Comet Lemmon is still inbound and brightening, passing nearest the Earth on October 21 and nearest the Sun on November 8.
Authors & editors: Robert Nemiroff (MTU) & Jerry Bonnell (UMCP)
NASA Official: Amber Straughn Specific rights apply.
NASA Web Privacy, Accessibility, Notices;
A service of: ASD at NASA / GSFC,
NASA Science Activation
& Michigan Tech. U.")
Alt...
2025 October 6
A comet with a green head at the bottom and a complex tail extending toward the top is shown, horizontally side by side, six times. Please see the explanation for more detailed information.
The Changing Ion Tail of Comet Lemmon
* Images Credit & Copyright: Victor Sabet & Julien De Winter
Explanation:
How does a comet tail change? It depends on the comet. The ion tail of Comet C/2025 A6 (Lemmon) has been changing markedly, as detailed in the featured image sequenced over six days between September 25 and October 3 (left to right) from Texas, USA. On some days, the comet's ion tail was relatively more complex than other days. Reasons for tail changes include the rate of ejection of material from the comet's nucleus, the strength and complexity of the passing solar wind, and the rotation rate of the comet. Sometimes, over the course of a week, apparent differences even result from a change of perspective from the Earth. In general, a comet's ion tail will point away from the Sun, as gas expelled is pushed out by the Sun's wind. Comet Lemmon is still inbound and brightening, passing nearest the Earth on October 21 and nearest the Sun on November 8.
Authors & editors: Robert Nemiroff (MTU) & Jerry Bonnell (UMCP)
NASA Official: Amber Straughn Specific rights apply.
NASA Web Privacy, Accessibility, Notices;
A service of: ASD at NASA / GSFC,
NASA Science Activation
& Michigan Tech. U.
From Contributors to Wikimedia projects:
[...]
Saturn's axial inclination
Saturn's axial tilt is 26.7°, meaning that widely varying views of the rings, of which the visible ones occupy its equatorial plane, are obtained from Earth at different times. Earth makes passes through the ring plane every 13 to 15 years, about every half Saturn year, and there are about equal chances of either a single or three crossings occurring in each such occasion. The most recent ring plane crossings were on 22 May 1995, 10 August 1995, 11 February 1996, 4 September 2009 and 23 March 2025; upcoming events will occur on 15 October 2038, 1 April 2039 and 9 July 2039. Favorable ring plane crossing viewing opportunities (with Saturn not close to the Sun) only come during triple crossings.
Saturn's equinoxes, when the Sun passes through the ring plane, are not evenly spaced. The sun passes south to north through the ring plane when Saturn's heliocentric longitude is 173.6 degrees (e.g. 11 August 2009), about the time Saturn crosses from Leo to Virgo. 15.7 years later Saturn's longitude reaches 353.6 degrees and the sun passes to the south side of the ring plane. On each orbit the Sun is north of the ring plane for 15.7 Earth years, then south of the plane for 13.7 years. Dates for north-to-south crossings include 19 November 1995 and 6 May 2025, with south-to-north crossings on 11 August 2009 and 23 January 2039. During the period around an equinox the illumination of most of the rings is greatly reduced, making possible unique observations highlighting features that depart from the ring plane.
[...]
More in next post.
* The ALT-Text for this image is pretty detailed, full discription of this image here:
https://commons.wikimedia.org/wiki/File:Saturn,_its_rings,_and_a_few_of_its_moons.jpg
#space #saturn #astrophotography #photography #science #astronomy #physics #nature #NASA #ESA #education

Alt...
Seen from our planet, the view of Saturn's rings during equinox is extremely foreshortened and limited. But in orbit around Saturn, Cassini has no such problems. From 20 degrees above the ring-plane, Cassini's wide angle camera shot 75 exposures in succession for this mosaic showing Saturn, its rings, and a few of its moons a day and a half after exact Saturn equinox, when the Sun's disk was exactly overhead at the planet's equator. The novel illumination geometry that accompanies equinox lowers the Sun's angle to the ring-plane, significantly darkens the rings, and causes out-of-plane structures to look anomalously bright and to cast shadows across the rings. These scenes are possible only during the few months before and after Saturn's equinox which occurs only once in about 15 Earth years. Also at equinox, the shadows of the planet's expansive rings are compressed into a single, narrow band cast onto the planet as seen in this mosaic. The images comprising the mosaic, taken over about eight hours, were extensively processed before being joined together. First, each was re-projected into the same viewing geometry and then digitally processed to make the image "joints" seamless and to remove lens flares, radially extended bright artefacts resulting from light being scattered within the camera optics ..
* URL for full image description in main text
CREDIT
NASA/JPL/Space Science Institute
From Contributors to Wikimedia projects:
[...]
The rings have numerous gaps where particle density drops sharply: two opened by known moons embedded within them, and many others at locations of known destabilizing orbital resonances with the moons of Saturn. Other gaps remain unexplained. Stabilizing resonances, on the other hand, are responsible for the longevity of several rings, such as the Titan Ringlet and the G Ring. Well beyond the main rings is the Phoebe ring, which is presumed to originate from Phoebe and thus share its retrograde orbital motion. It is aligned with the plane of Saturn's orbit. Saturn has an axial tilt of 27 degrees, so this ring is tilted at an angle of 27 degrees to the more visible rings orbiting above Saturn's equator.
[...]
More in next post.
* The ALT-Texts for the images are pretty detailed, full discription for
+ upper right image:
https://en.wikipedia.org/wiki/File:Saturn%27s_rings_in_visible_light_and_radio.jpg
#space #saturn #astrophotography #photography #science #astronomy #physics #nature #NASA #ESA #education
 taken on May 9, 2007 (distances are to the planet's center).
A scan across Saturn's incredible halo of ice rings yields a study in precision and order. This natural color mosaic was acquired by the Cassini spacecraft as it soared 39 degrees above the unilluminated side of the rings. Major named gaps are labeled at the top. The main rings themselves, along with the F ring, are labeled at the bottom, along with their inner and outer boundaries. This mosaic was constructed from narrow-angle camera images taken immediately after the wide-angle camera mosaic PIA08388. Radial features can be seen in the rings that are about ten times smaller than in the wide-angle view. This scan is rotated 180 degrees compared to PIA08388 in order to present the rings with distance from Saturn increasing left to right. The view combines 45 images -- 15 separate sets of red, green and blue images -- taken over the course of about 2.5 hours, as Cassini scanned across the rings. The images in this view were obtained on May 9, 2007, at a distance of approximately 1.1 million kilometers (700,000 miles) from Saturn. Image scale in the radial (horizontal) direction is about 6 kilometers (4 miles) per pixel.
CREDIT
NASA/JPL/Space Science Institute")
Alt...
Natural-color mosaic of Cassini narrow-angle camera images of the unilluminated side of Saturn's D, C, B, A and F rings (left to right) taken on May 9, 2007 (distances are to the planet's center).
A scan across Saturn's incredible halo of ice rings yields a study in precision and order. This natural color mosaic was acquired by the Cassini spacecraft as it soared 39 degrees above the unilluminated side of the rings. Major named gaps are labeled at the top. The main rings themselves, along with the F ring, are labeled at the bottom, along with their inner and outer boundaries. This mosaic was constructed from narrow-angle camera images taken immediately after the wide-angle camera mosaic PIA08388. Radial features can be seen in the rings that are about ten times smaller than in the wide-angle view. This scan is rotated 180 degrees compared to PIA08388 in order to present the rings with distance from Saturn increasing left to right. The view combines 45 images -- 15 separate sets of red, green and blue images -- taken over the course of about 2.5 hours, as Cassini scanned across the rings. The images in this view were obtained on May 9, 2007, at a distance of approximately 1.1 million kilometers (700,000 miles) from Saturn. Image scale in the radial (horizontal) direction is about 6 kilometers (4 miles) per pixel.
CREDIT
NASA/JPL/Space Science Institute
. An \"image\" is then constructed by assuming circular symmetry over the ring region of interest. Color is usually added to encode other information related to the observed structure. This image compares structure of Saturn's rings observed by these two approaches. The upper half is a natural color mosaic of images of the illuminated side of the rings by the Cassini narrow-angle camera (see PIA06175). The bottom simulated image is constructed from a radio occultation observation conducted on May 3, 2005. For another view created using this process, see PIA07872. Color in the lower image is used to represent information about ring particle sizes ..
* URL for full image description in main text
CREDIT
NASA/JPL/Space Science Institute")
Alt...
Cassini instruments provide complementary information about the structure of Saturn's rings. Narrow and wide angle cameras provide images in the visible region of the electromagnetic spectrum much like a digital camera does. The images have information about how the ring structure differs both with distance from the planet and with position around the equatorial circle. However, resolution is usually limited to few kilometers at best. Radio and stellar occultations of the rings also provide important information about ring structure, but only along a one-dimensional track through the rings. The radial resolution can be as fine as 50 meters (164 feet). An "image" is then constructed by assuming circular symmetry over the ring region of interest. Color is usually added to encode other information related to the observed structure. This image compares structure of Saturn's rings observed by these two approaches. The upper half is a natural color mosaic of images of the illuminated side of the rings by the Cassini narrow-angle camera (see PIA06175). The bottom simulated image is constructed from a radio occultation observation conducted on May 3, 2005. For another view created using this process, see PIA07872. Color in the lower image is used to represent information about ring particle sizes ..
* URL for full image description in main text
CREDIT
NASA/JPL/Space Science Institute
 from Saturn and at a Sun-Saturn-spacecraft, or phase, angle of 133 degrees. Image scale is 2.2 miles (3.6 kilometers) per pixel.
CREDIT
NASA/JPL/Space Science Institute")
Alt...
Not all of Saturn's rings are created equal: here the C and D rings appear side-by-side, but the C ring, which occupies the bottom half of this image, clearly outshines its neighbor. The D ring appears fainter than the C ring because it is comprised of less material. However, even rings as thin as the D ring can pose hazards to spacecraft. Given the high speeds at which Cassini travels, impacts with particles just fractions of a millimeter in size have the potential to damage key spacecraft components and instruments. Nonetheless, near the end of Cassini's mission, navigators plan to thread the spacecraft's orbit through the narrow region between the D ring and the top of Saturn's atmosphere. This view looks toward the unilluminated side of the rings from about 12 degrees below the ringplane. The image was taken in visible light with the Cassini spacecraft narrow-angle camera on Feb. 11, 2015. The view was acquired at a distance of approximately 372,000 miles (599,000 kilometers) from Saturn and at a Sun-Saturn-spacecraft, or phase, angle of 133 degrees. Image scale is 2.2 miles (3.6 kilometers) per pixel.
CREDIT
NASA/JPL/Space Science Institute
 from Saturn. The image scale is 4.6 kilometers (2.9 miles) per pixel.
CREDIT
NASA/JPL/Space Science Institute")
Alt...
This fantastic close-up of Saturn's outer C ring shows large and sharp changes in brightness across the rings, owing to the extreme variations in ring particle concentrations at different distances from the planet. The dark gap running through the center contains the Maxwell ringlet, as well as a faint, narrow ringlet discovered in Cassini images. Another very dark region to the right of the Maxwell gap is also a narrow gap. The image was taken in visible light with the Cassini spacecraft narrow angle camera on Oct. 29, 2004, at a distance of about 836,000 kilometers (519,000 miles) from Saturn. The image scale is 4.6 kilometers (2.9 miles) per pixel.
CREDIT
NASA/JPL/Space Science Institute
From Contributors to Wikimedia projects:
Rings of Saturn
Saturn has the most extensive and complex ring system of any planet in the Solar System. The rings consist of particles in orbit around the planet and are made almost entirely of water ice, with a trace component of rocky material. Particles range from micrometers to meters in size. There is no consensus as to what mechanism facilitated their formation: while investigations using theoretical models suggested they formed early in the Solar System's existence, newer data from Cassini suggests a more recent date of formation. In September 2023, astronomers reported studies suggesting that the rings of Saturn may have resulted from the collision of two moons "a few hundred million years ago,".
Though light reflected from the rings increases Saturn's apparent brightness, they are not themselves visible from Earth with the naked eye. In 1610, the year after his first observations with a telescope, Galileo Galilei became the first person to observe Saturn's rings, though he could not see them well enough to discern their true nature. In 1655, Christiaan Huygens was the first person to describe them as a disk surrounding Saturn. The concept that Saturn's rings are made up of a series of tiny ringlets can be traced to Pierre-Simon Laplace, although true gaps are few – it is more correct to think of the rings as an annular disk with concentric local maxima and minima in density and brightness.
[..]
Read more next post ..
* The ALT-Texts for the images are pretty detailed, full discription for
+ upper left image:
https://commons.wikimedia.org/wiki/File:PIA17172_Saturn_eclipse_mosaic_bright_crop.jpg
+ and the upper right image: https://commons.wikimedia.org/wiki/File:Unraveling_Saturn%27s_Rings.jpg
#space #saturn #astrophotography #photography #science #astronomy #physics #nature #NASA #ESA #education
 distant. Earth appears as a dot at 4 o'clock, between the G and E rings – with its brightness artificially exaggerated in this photograph.
CREDIT
NASA
JPL-Caltech
Space Science Institute
On July 19, 2013, in an event celebrated the world over, NASA's Cassini spacecraft slipped into Saturn's shadow and turned to image the planet, seven of its moons, its inner rings -- and, in the background, our home planet, Earth. With the sun's powerful and potentially damaging rays eclipsed by Saturn itself, Cassini's onboard cameras were able to take advantage of this unique viewing geometry. They acquired a panoramic mosaic of the Saturn system that allows scientists to see details in the rings and throughout the system as they are backlit by the sun.
With both Cassini's wide-angle and narrow-angle cameras aimed at Saturn, Cassini was able to capture 323 images in just over four hours. This final mosaic uses 141 of those wide-angle images. Images taken using the red, green and blue spectral filters of the wide-angle camera were combined and mosaicked together to create this natural-color view. This image spans about 404,880 miles (651,591 kilometers) across. The outermost ring shown here is Saturn's E ring, the core of which is situated about 149,000 miles (240,000 kilometers) from Saturn
*See URL to full discription in main text")
Alt...
The full set of rings, imaged on 19 July 2013 as Saturn eclipses the Sun from the vantage of the Cassini orbiter, 1.2 million kilometres (3⁄4 million miles) distant. Earth appears as a dot at 4 o'clock, between the G and E rings – with its brightness artificially exaggerated in this photograph.
CREDIT
NASA
JPL-Caltech
Space Science Institute
On July 19, 2013, in an event celebrated the world over, NASA's Cassini spacecraft slipped into Saturn's shadow and turned to image the planet, seven of its moons, its inner rings -- and, in the background, our home planet, Earth. With the sun's powerful and potentially damaging rays eclipsed by Saturn itself, Cassini's onboard cameras were able to take advantage of this unique viewing geometry. They acquired a panoramic mosaic of the Saturn system that allows scientists to see details in the rings and throughout the system as they are backlit by the sun.
With both Cassini's wide-angle and narrow-angle cameras aimed at Saturn, Cassini was able to capture 323 images in just over four hours. This final mosaic uses 141 of those wide-angle images. Images taken using the red, green and blue spectral filters of the wide-angle camera were combined and mosaicked together to create this natural-color view. This image spans about 404,880 miles (651,591 kilometers) across. The outermost ring shown here is Saturn's E ring, the core of which is situated about 149,000 miles (240,000 kilometers) from Saturn
*See URL to full discription in main text
 were sent from Cassini through the rings to Earth. The observed change of each signal as Cassini moved behind the rings provided a profile of the distribution of ring material as a function of distance from Saturn, or an optical depth profile. This simulated image was constructed from the measured optical depth profiles. It depicts the observed ring structure at a resolution of about 10 kilometers (6 miles). Shades of purple, primarily over most of the middle ring, the B ring, and the inner portion of the outer ring, the A ring, indicate regions where there is a lack of particles less than 5 centimeters (about 2 inches) in diameter. Green and blue shades indicate regions where there are particles of sizes smaller than 5 centimeters (2 inches) and 1 centimeter (less than one third of an inch), respectively, primarily in the outer A ring and within most of the inner ring, the C ring ...
* See URL to full discription in main text
CREDIT
NASA / JPL")
Alt...
In this simulated image of Saturn's rings, color is used to present information about ring particle sizes in different regions based on the measured attenuations of three radio signals. Specially designed Cassini orbits place Earth and Cassini on opposite sides of Saturn's rings, a geometry known as occultation. Cassini conducted the first radio occultation observation of Saturn's rings on May 3, 2005. Three simultaneous radio signals of 0.94, 3.6, and 13 centimeter wavelength (Ka-, X-, and S-bands) were sent from Cassini through the rings to Earth. The observed change of each signal as Cassini moved behind the rings provided a profile of the distribution of ring material as a function of distance from Saturn, or an optical depth profile. This simulated image was constructed from the measured optical depth profiles. It depicts the observed ring structure at a resolution of about 10 kilometers (6 miles). Shades of purple, primarily over most of the middle ring, the B ring, and the inner portion of the outer ring, the A ring, indicate regions where there is a lack of particles less than 5 centimeters (about 2 inches) in diameter. Green and blue shades indicate regions where there are particles of sizes smaller than 5 centimeters (2 inches) and 1 centimeter (less than one third of an inch), respectively, primarily in the outer A ring and within most of the inner ring, the C ring ...
* See URL to full discription in main text
CREDIT
NASA / JPL
 infrared light. In the false-color IR view, greater water ice content and larger grain size lead to blue-green color, while greater non-ice content and smaller grain size yield a reddish hue.
PIA23170: Infrared Eye Yields New Spectral Map
The false-color image at right shows spectral mapping of Saturn's A, B and C rings, captured by Cassini's Visible and Infrared Mapping Spectrometer (VIMS). It displays an infrared view of the rings, rather than an image in visible light. The blue-green areas are the regions with the purest water ice and/or largest grain size (primarily the A and B rings), while the reddish color indicates increasing amounts of non-icy material and/or smaller grain sizes (primarily in the C ring and Cassini Division). At left, the same image is overlaid on a natural-color mosaic of Saturn taken by Cassini's Imaging Science Subsystem.
CREDIT
NASA/JPL-Caltech")
Alt...
Saturn and its A, B and C rings in visible and (inset) infrared light. In the false-color IR view, greater water ice content and larger grain size lead to blue-green color, while greater non-ice content and smaller grain size yield a reddish hue.
PIA23170: Infrared Eye Yields New Spectral Map
The false-color image at right shows spectral mapping of Saturn's A, B and C rings, captured by Cassini's Visible and Infrared Mapping Spectrometer (VIMS). It displays an infrared view of the rings, rather than an image in visible light. The blue-green areas are the regions with the purest water ice and/or largest grain size (primarily the A and B rings), while the reddish color indicates increasing amounts of non-icy material and/or smaller grain sizes (primarily in the C ring and Cassini Division). At left, the same image is overlaid on a natural-color mosaic of Saturn taken by Cassini's Imaging Science Subsystem.
CREDIT
NASA/JPL-Caltech
 is round and has a variety of terrains across its surface. Meanwhile, Hyperion (to the upper-left of Tethys) is the \"wild one\" with a chaotic spin and Prometheus (lower-left) is a tiny moon that busies itself sculpting the F ring. To learn more about the surface of Tethys (660 miles, or 1,062 kilometers across), see PIA17164. More on the chaotic spin of Hyperion (168 miles, or 270 kilometers across) can be found at PIA07683. And discover more about the role of Prometheus (53 miles, or 86 kilometers across) in shaping the F ring in PIA12786. This view looks toward the sunlit side of the rings from about 1 degree above the ringplane. The image was taken in visible light with the Cassini spacecraft narrow-angle camera on July 14, 2014. The view was acquired at a distance of approximately 1.2 million miles (1.9 million kilometers) from Tethys and at a Sun-Tethys-spacecraft, or phase, angle of 22 degrees. Image scale is 7 miles (11 kilometers) per pixel.
CREDIT
NASA/JPL-Caltech")
Alt...
The Odd Trio September 22, 2014
The Cassini spacecraft captures a rare family photo of three of Saturn's moons that couldn't be more different from each other! As the largest of the three, Tethys (image center) is round and has a variety of terrains across its surface. Meanwhile, Hyperion (to the upper-left of Tethys) is the "wild one" with a chaotic spin and Prometheus (lower-left) is a tiny moon that busies itself sculpting the F ring. To learn more about the surface of Tethys (660 miles, or 1,062 kilometers across), see PIA17164. More on the chaotic spin of Hyperion (168 miles, or 270 kilometers across) can be found at PIA07683. And discover more about the role of Prometheus (53 miles, or 86 kilometers across) in shaping the F ring in PIA12786. This view looks toward the sunlit side of the rings from about 1 degree above the ringplane. The image was taken in visible light with the Cassini spacecraft narrow-angle camera on July 14, 2014. The view was acquired at a distance of approximately 1.2 million miles (1.9 million kilometers) from Tethys and at a Sun-Tethys-spacecraft, or phase, angle of 22 degrees. Image scale is 7 miles (11 kilometers) per pixel.
CREDIT
NASA/JPL-Caltech
From Contributors to Wikimedia projects:
SATURN AS SEEN BY GALILEO. Detail of the letter sent by Galileo to Belisario Vinta, written in Padova on 30.07.1610. The shape of Saturn first seen by the Pisan astronomer, squared in green. Here Galileo writes: "It is that the star of Saturn is not a single one, but an aggregate of three that almost touch each other and that never move or change with each other, they are arranged in a row along the Zodiac, the middle one being three times larger than the other two lateral ones and being situated in this way: oOo,..."
From "Galileo-Kepler. The Message and the Sidereal Messenger", Alianza Editorial. 1984. In another letter addressed to Giuliano de Medici, Galileo writes: "... I observed that the highest planet was threefold: that is, with great admiration on my part I have observed that Saturn is not a single star, but three together that almost touch. They are completely immobile with each other, arranged in this way oOo, the middle one being much larger than the lateral ones. They are situated one to the east and to the west of the other, exactly in a straight line. They are not just according to the line of the Zodiac, but the western line rises somewhat to the north; perhaps they are parallel to the equator.
If it were observed with a spectacle that was not of great magnification, three very different stars would not appear, but Saturn would appear to be an elongated star in the shape of an olive, like this [small ellipse]; but by means of a spectacle that multiplies more than a thousand times on the surface, the three globes will be seen very clear and almost touching, not appearing between them a division greater than a subtle dark thread..."
Image Credit:
Galileo Galilei - Museo Galileo Galilei, Florence. Biblioteca Nazionale Centrale, Ms. Gal. 86, f. 42r
#space #saturn #astrophotography #photography #science #astronomy #physics #nature #history #NASA #ESA #education

Alt...
SATURN AS SEEN BY GALILEO. Detail of the letter sent by Galileo to Belisario Vinta, written in Padova on 30.07.1610. The shape of Saturn first seen by the Pisan astronomer, squared in green. Here Galileo writes: "It is that the star of Saturn is not a single one, but an aggregate of three that almost touch each other and that never move or change with each other, they are arranged in a row along the Zodiac, the middle one being three times larger than the other two lateral ones and being situated in this way: oOo,..."
From "Galileo-Kepler. The Message and the Sidereal Messenger", Alianza Editorial. 1984. In another letter addressed to Giuliano de Medici, Galileo writes: "... I observed that the highest planet was threefold: that is, with great admiration on my part I have observed that Saturn is not a single star, but three together that almost touch. They are completely immobile with each other, arranged in this way oOo, the middle one being much larger than the lateral ones. They are situated one to the east and to the west of the other, exactly in a straight line. They are not just according to the line of the Zodiac, but the western line rises somewhat to the north; perhaps they are parallel to the equator.
Image Credit:
Galileo Galilei - Museo Galileo Galilei, Florence. Biblioteca Nazionale Centrale, Ms. Gal. 86, f. 42r
![[?]](https://cdn.hosted.spacebear.ee/sb-444643948490e1fed8199ed78bf1ee5f/accounts/avatars/109/371/733/810/294/907/original/adb71e94b9377654.png)
New today: “SB 8 seeks to establish a precedent that treats marginalized communities in the Lone Star State as less than equal. In reality, #trans folks are parts of #Texas families, workplaces, schools, and communities, and we are here to stay.” https://www.texasobserver.org/texas-bathroom-bill-weaponizes-transphobia/
#politics #USpol #news #LGBTQIA+ #HumanRights #genocide #fascism #education
Getting better at software engineering https://lobste.rs/s/vqm0yu #education #programming
https://madhadron.com/getting_better_at_programming.html
Starting a moon exploration tour from the couch? Why not? With a good internet connection, you can hit the ground running right away and enjoy your moonwalk:
https://trek.nasa.gov/moon/#v=0.1&x=0&y=0&z=1&p=urn%3Aogc%3Adef%3Acrs%3AEPSG%3A%3A104903&d=&locale=&b=moon&e=-281.2499947536844%2C-131.83593504078956%2C281.2499947536844%2C131.83593504078956&sfz=&w=
And don't forget: The Trump administration has cut off NASA's financial support from government funds! It stands to reason that this institution is to be weakened by financial erosion in order to then privatise it and sell it cheaply to loyal greedy super-rich. So no one can know how long all this information and data will be publicly available, which is now the property of the American people and the calling card for a United America. Do we really want to put up with THAT? This country is still called "United States of America" and may this name preserve its values for a long time to come! Stop freezing like the rabbit before the poison snake, stay strong and unite USA and finally defend yourself against your malicious destruction by greedy narcissists!
#space #moon #astrophotography #photography #science #astronomy #nature #NASA #education #us #uspol #trump #usa #europe #italy #france #unitedkingdom #resist

Alt...
Moon Trek allows you to explore the Moon via your own computer. Credit: NASA/SSERVI
Data and Music: What 50 Years of Exploring Our Moon Sounds Like
Sonification is the process of translating data into sound and music. In this musical data sonification of lunar knowledge and exploration, we can hear the progress made throughout the Apollo program to now as our understanding of the Moon expands. Listen to the percussion, which signals launches and the passage of time; the pitch of the string and brass instruments conveys the amount of scientific activity associated with the Moon over time.
Here’s a breakdown of the individual instruments:
Pitch of the string and brass = scientific activity
Percussion instruments = passage of time
Clock ticking = months
Snare drum = years
Bass drum = decades
Cymbals = launches
In the video, the blue line indicates the amount of scientific activity (the number of scientific publications, citations and patents) in each year that is related to NASA’s Apollo program. The red and yellow lines indicate the amount of scientific activity associated with Apollo samples and Apollo images, respectively. The other colors indicate the amount of scientific activity associated with each of NASA’s lunar robotic missions.
Each year's data represents the number of articles, citations and patents dated in that year and returned by Google Scholar when applying a certain set of keywords.
CREDIT
NASA's Goddard Space Flight Center
SYSTEM Sounds
Data sonification and visualization by Matt Russo and Andrew Santaguida of SYSTEM Sounds. Data compiled by NASA.
Music credits: "Giant Leaps" by SYSTEM Sounds
https://svs.gsfc.nasa.gov/13204
#space #moon #astrophotography #photography #science #astronomy #nature #NASA #education
You're Invited!
The next International Observe the Moon Night is tonight !
International Observe the Moon Night is a time to come together with fellow Moon enthusiasts and curious people worldwide. Everyone on Earth is invited to learn about lunar science and exploration, take part in celestial observations, and honor cultural and personal connections to the Moon. We encourage everyone to interpret “observe” broadly!
International Observe the Moon Night occurs annually in September or October, when the Moon is around first quarter ― a great phase for evening observing. A first-quarter Moon offers excellent viewing opportunities along the terminator (the line between night and day), where shadows enhance the Moon’s cratered landscape.
You can join International Observe the Moon Night from wherever you are. Attend or host a virtual or in-person event, or observe the Moon from home. Connect with fellow lunar enthusiasts around the world by using #ObserveTheMoon on your preferred social media platform and visiting the International Observe the Moon Night Flickr group.
Outdoors, at home, online, or wherever you may be, we’re glad to have you with us. However you choose to observe, please follow local guidelines on health and safety.
* Unite people across the globe in a celebration of lunar observation, science, and exploration.
* Provide information, a platform, and resources in order to:
* Raise awareness of NASA’s lunar science and exploration programs.
* Empower people to learn more about the Moon and space science and exploration, using Earth’s Moon as an accessible entry point.
* Facilitate sharing of Moon-inspired stories, images, artwork, and more.
* Inspire continued observation of the Moon, the sky, and the world around us.
* Support all people who are interested in learning more about, and connecting to, the Moon.
https://moon.nasa.gov/observe-the-moon-night/about/overview/
https://moon.nasa.gov/observe-the-moon-night/participate/10-ways-to-observe-the-moon/
#space #moon #astrophotography #photography #science #astronomy #nature #NASA #education
Alt...
Video trailer for International Observe the Moon Night 2025.
https://moon.nasa.gov/observe-the-moon-night/
Join In!
The countdown is on.. for the International Observe the Moon Night 2025 on October 4!
https://moon.nasa.gov/observe-the-moon-night/
https://moon.nasa.gov/observe-the-moon-night/register/individual-participation/
#space #moon #astrophotography #photography #science #astronomy #nature #NASA #education
Abell 2744: Pandora's Cluster Revealed
X-ray, Optical & Lensing Map Images of Abell 2744
One of the most complicated and dramatic collisions between galaxy clusters ever seen is captured in this new composite image. This collision site, known officially as Abell 2744, has been dubbed "Pandora's Cluster" because of the wide variety of different structures seen. Data from NASA's Chandra X-ray Observatory are colored red, showing gas with temperatures of millions of degrees. In blue is a map showing the total mass concentration (mostly dark matter) based on data from the Hubble Space Telescope (HST), the European Southern Observatory's Very Large Telescope (VLT), and the Japanese Subaru telescope. Optical data from HST and VLT also show the constituent galaxies of the clusters.
The "core" region shows a bullet-shaped structure in the X-ray emitting hot gas and a separation between the hot gas and the dark matter. (As a guide, local peaks in the distribution of hot gas and overall matter in the different regions are shown with red and blue circles respectively). This separation occurs because electric forces between colliding particles in the clouds of hot gas create a friction that slows them down, while dark matter is unaffected by such forces.
In the Northwest ("NW") region, a much larger separation is seen between the hot gas and the dark matter. Surprisingly, the hot gas leads the "dark" clump (mostly dark matter) by about 500,000 light years. [...]
https://chandra.harvard.edu/photo/2011/a2744/
CREDIT
X-ray: NASA/CXC/ITA/INAF/J.Merten et al
Lensing: NASA/STScI; NAOJ/Subaru; ESO/VLT
Optical: NASA/STScI/R.Dupke)
#space #cluster #astrophotography #photography #science #astronomy #physics #nature #NASA #education
 based on data from the Hubble Space Telescope, the Very Large Telescope, and the Japanese Subaru telescope. Optical data also show the constituent galaxies of the clusters. The \"core\" region shows a slightly bullet shaped structure in the X-ray emitting hot gas (the diving bird) and a separation between the hot gas and the dark matter. This separation occurs because electromagnetic forces between colliding particles in the clouds of hot gas create a friction that slows them down, while dark matter is unaffected by such forces")
Alt...
The composite image of galaxy cluster Abell 2744 showcases an array of distant galaxies, hot gas and other celestial objects. The image features a vibrant pink and blue-purple hue, which is prevalent throughout the galaxy cluster, creating a captivating contrast against the dark blue background. At the center of the image, there is a large hot pink gaseous shape, almost like a mottled bird, diving into the more blue-purple nebulous area. The gaseous, nebulous shapes are littered with bright white-yellow pops of light, like too many holiday lights on a tree. This object was created by one of the most complicated and dramatic collisions between galaxy clusters ever seen. It has been dubbed "Pandora's Cluster" because of the wide variety of different structures seen. Data from NASA's Chandra X-ray Observatory are colored pink-red, showing gas with temperatures of millions of degrees. In blue is a map showing the total mass concentration (mostly dark matter) based on data from the Hubble Space Telescope, the Very Large Telescope, and the Japanese Subaru telescope. Optical data also show the constituent galaxies of the clusters. The "core" region shows a slightly bullet shaped structure in the X-ray emitting hot gas (the diving bird) and a separation between the hot gas and the dark matter. This separation occurs because electromagnetic forces between colliding particles in the clouds of hot gas create a friction that slows them down, while dark matter is unaffected by such forces
 based on data from the Hubble Space Telescope, the Very Large Telescope (VLT), and the Subaru telescope. Optical data from HST and VLT also show the constituent galaxies of the clusters. Astronomers think at least four galaxy clusters coming from a variety of directions are involved with this collision.
CREDIT
X-ray: NASA/CXC/ITA/INAF/J.Merten et al,
Lensing: NASA/STScI; NAOJ/Subaru; ESO/VLT,
Optical: NASA/STScI/R.Dupke")
Alt...
Labeled image of Abell 2744
These images feature one of the most complicated and dramatic collisions between galaxy clusters ever seen. Known officially as Abell 2744, this system has been dubbed "Pandora's Cluster" because of the wide variety of different structures found. Data from Chandra show gas with temperatures of millions of degrees. Next is a map showing the total mass concentration (mostly dark matter) based on data from the Hubble Space Telescope, the Very Large Telescope (VLT), and the Subaru telescope. Optical data from HST and VLT also show the constituent galaxies of the clusters. Astronomers think at least four galaxy clusters coming from a variety of directions are involved with this collision.
CREDIT
X-ray: NASA/CXC/ITA/INAF/J.Merten et al,
Lensing: NASA/STScI; NAOJ/Subaru; ESO/VLT,
Optical: NASA/STScI/R.Dupke

Alt...
LMap image of Abell 2744
CREDIT
X-ray: NASA/CXC/ITA/INAF/J.Merten et al,
Lensing: NASA/STScI; NAOJ/Subaru; ESO/VLT,
Optical: NASA/STScI/R.Dupke

Alt...
X-ray image of Abell 2744
CREDIT
X-ray: NASA/CXC/ITA/INAF/J.Merten et al,
Lensing: NASA/STScI; NAOJ/Subaru; ESO/VLT,
Optical: NASA/STScI/R.Dupke
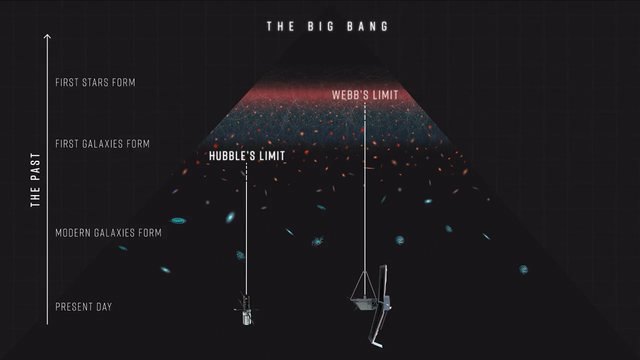
Gravity – Nature’s Magnifying Glass
This video explains how very distant galaxies are magnified through the phenomenon of gravitational lensing. Gravitational lenses can magnify the light from distant galaxies that are at or near the peak of star formation. This effect allows researchers to study the details of early galaxies too far away to be seen with even the most powerful space telescopes.
Credit
NASA, ESA, CSA, STScI, Leah Hustak (STScI)
https://science.nasa.gov/asset/webb/gravity-natures-magnifying-glass/ <- Due to the lapse in federal government funding, NASA is not updating this website.
#space #galaxy #astrophotography #photography #science #physics #nature #NASA #ESA #education
Alt...
This video explains how very distant galaxies are magnified through the phenomenon of gravitational lensing. Gravitational lenses can magnify the light from distant galaxies that are at or near the peak of star formation. This effect allows researchers to study the details of early galaxies too far away to be seen with even the most powerful space telescopes.
Credit
NASA, ESA, CSA, STScI, Leah Hustak (STScI)
![[?]](https://files.mastodon.social/accounts/avatars/113/153/228/648/498/791/original/a051c2a071677670.jpg)
Graham Platner said while campaigning for the Senate against Susan Collins that he wants "fully funded schools and hospitals, because that’s where taxpayer dollars should go, not destroying them in Gaza.”
#healthcare #education #politics #WarCrimes
To help understand the diversity of terrain and to piece together how Pluto’s surface has formed and evolved over time, mission scientists construct geological maps like the one shown upper left.
This map covers a portion of Pluto’s surface that measures 1,290 miles (2,070 kilometers) from top to bottom, and includes the vast nitrogen-ice plain informally named Sputnik Planum and surrounding terrain. As the key in the figure below indicates, the map is overlaid with colors that represent different geological terrains. Each terrain, or unit, is defined by its texture and morphology – smooth, pitted, craggy, hummocky or ridged, for example. How well a unit can be defined depends on the resolution of the images that cover it. All of the terrain in this map has been imaged at a resolution of approximately 1,050 feet (320 meters) per pixel or better, meaning scientists can map units with relative confidence The various blue and greenish units that fill the center of the map represent different textures seen across Sputnik Planum, from the cellular terrain in the center and north, to the smooth and pitted plains in the south. The black lines represent troughs that mark the boundaries of cellular regions in the nitrogen ice. The purple unit represents the chaotic, blocky mountain ranges that line Sputnik’s western border, and the pink unit represents the scattered, floating hills at its eastern edge. The possible cryovolcanic feature informally named Wright Mons is mapped in red in the southern corner of the map. The rugged highlands of the informally named Cthulhu Regio are mapped in dark brown along the western edge, pockmarked by many large impact craters, shown in yellow.
[...]
Please read more in the ALT-Text of the map (left image)
#space #pluto #astrophotography #photography #science #astronomy #nature #NASA #education
![[...]
By studying how the boundaries between units crosscut one another, mission scientists can determine which units overlie others, and assemble a relative chronology for the different units. For example, the yellow craters (at left, on the western edge of the map) must have formed after their surrounding terrain. Producing such maps is important for gauging what processes have operated where on Pluto, and when they occurred relative to other processes at work. The base map for this geologic map is a mosaic of 12 images obtained by the Long Range Reconnaissance Imager (LORRI) at a resolution of 1,280 feet (about 390 meters) per pixel. The mosaic was obtained at a range of approximately 48,000 miles (77,300 kilometers) from Pluto, about an hour and 40 minutes before New Horizons' closest approach on July 14, 2015. (Last Updated: Feb. 11, 2016 - Editor: Tricia Talbert) The original NASA image has been cropped by the uploader.
CREDIT
NASA / Johns Hopkins University Applied Physics Laboratory / Southwest Research Institute](https://files.defcon.social/dcsocial-s3/media_attachments/files/115/306/221/513/300/442/original/db3f7f42bc1db26b.jpg "[...]
By studying how the boundaries between units crosscut one another, mission scientists can determine which units overlie others, and assemble a relative chronology for the different units. For example, the yellow craters (at left, on the western edge of the map) must have formed after their surrounding terrain. Producing such maps is important for gauging what processes have operated where on Pluto, and when they occurred relative to other processes at work. The base map for this geologic map is a mosaic of 12 images obtained by the Long Range Reconnaissance Imager (LORRI) at a resolution of 1,280 feet (about 390 meters) per pixel. The mosaic was obtained at a range of approximately 48,000 miles (77,300 kilometers) from Pluto, about an hour and 40 minutes before New Horizons' closest approach on July 14, 2015. (Last Updated: Feb. 11, 2016 - Editor: Tricia Talbert) The original NASA image has been cropped by the uploader.
CREDIT
NASA / Johns Hopkins University Applied Physics Laboratory / Southwest Research Institute")
Alt...
[...]
By studying how the boundaries between units crosscut one another, mission scientists can determine which units overlie others, and assemble a relative chronology for the different units. For example, the yellow craters (at left, on the western edge of the map) must have formed after their surrounding terrain. Producing such maps is important for gauging what processes have operated where on Pluto, and when they occurred relative to other processes at work. The base map for this geologic map is a mosaic of 12 images obtained by the Long Range Reconnaissance Imager (LORRI) at a resolution of 1,280 feet (about 390 meters) per pixel. The mosaic was obtained at a range of approximately 48,000 miles (77,300 kilometers) from Pluto, about an hour and 40 minutes before New Horizons' closest approach on July 14, 2015. (Last Updated: Feb. 11, 2016 - Editor: Tricia Talbert) The original NASA image has been cropped by the uploader.
CREDIT
NASA / Johns Hopkins University Applied Physics Laboratory / Southwest Research Institute
, doi: 10.1016/j.icarus.2017.01.011
CREDIT
Oliver L. White, Jeffrey M. Moore, William B. McKinnon, John R. Spencer, Alan D. Howard, Paul M. Schenk, Ross A. Beyer, Francis Nimmo, Kelsi N. Singer, Orkan M. Umurhan, S. Alan Stern, Kimberly Ennico, Cathy B. Olkin, Harold A. Weaver, Leslie A. Young, Andrew F. Cheng, Tanguy Bertrand, Richard P. Binzel, Alissa M. Earle, Will M. Grundy, Tod R. Lauer, Silvia Protopapa, Stuart J. Robbins, Bernard Schmitt, the New Horizons Science Team")
Alt...
Annotated map of Sputnik Planitia on Pluto
- Geological mapping of Sputnik Planitia on Pluto, Icarus (2017), doi: 10.1016/j.icarus.2017.01.011
CREDIT
Oliver L. White, Jeffrey M. Moore, William B. McKinnon, John R. Spencer, Alan D. Howard, Paul M. Schenk, Ross A. Beyer, Francis Nimmo, Kelsi N. Singer, Orkan M. Umurhan, S. Alan Stern, Kimberly Ennico, Cathy B. Olkin, Harold A. Weaver, Leslie A. Young, Andrew F. Cheng, Tanguy Bertrand, Richard P. Binzel, Alissa M. Earle, Will M. Grundy, Tod R. Lauer, Silvia Protopapa, Stuart J. Robbins, Bernard Schmitt, the New Horizons Science Team
, doi: 10.1016/j.icarus.2017.01.011
CREDIT
Oliver L. White, Jeffrey M. Moore, William B. McKinnon, John R. Spencer, Alan D. Howard, Paul M. Schenk, Ross A. Beyer, Francis Nimmo, Kelsi N. Singer, Orkan M. Umurhan, S. Alan Stern, Kimberly Ennico, Cathy B. Olkin, Harold A. Weaver, Leslie A. Young, Andrew F. Cheng, Tanguy Bertrand, Richard P. Binzel, Alissa M. Earle, Will M. Grundy, Tod R. Lauer, Silvia Protopapa, Stuart J. Robbins, Bernard Schmitt, the New Horizons Science Team")
Alt...
A topographic image of the Sputnik Planitia basin, showing the rising scarps bordering the glacial plains. The banding is an artefact of the camera.
- Geological mapping of Sputnik Planitia on Pluto, Icarus (2017), doi: 10.1016/j.icarus.2017.01.011
CREDIT
Oliver L. White, Jeffrey M. Moore, William B. McKinnon, John R. Spencer, Alan D. Howard, Paul M. Schenk, Ross A. Beyer, Francis Nimmo, Kelsi N. Singer, Orkan M. Umurhan, S. Alan Stern, Kimberly Ennico, Cathy B. Olkin, Harold A. Weaver, Leslie A. Young, Andrew F. Cheng, Tanguy Bertrand, Richard P. Binzel, Alissa M. Earle, Will M. Grundy, Tod R. Lauer, Silvia Protopapa, Stuart J. Robbins, Bernard Schmitt, the New Horizons Science Team
 in size, and the mosaic covers a region roughly 1,000 miles (1600 kilometers) wide. The image was taken as New Horizons flew past Pluto on July 14, 2015, from a distance of 50,000 miles (80,000 kilometers). The Johns Hopkins University Applied Physics Laboratory in Laurel, Maryland, designed, built, and operates the New Horizons spacecraft, and manages the mission for NASA's Science Mission Directorate. The Southwest Research Institute, based in San Antonio, leads the science team, payload operations and encounter science planning. New Horizons is part of the New Frontiers Program managed by NASA's Marshall Space Flight Center in Huntsville, Alabama. UPLOADER NOTES: The original NASA image has been modified by the uploader as follows: rotating clockwise 90°, extending the lower border by 154 pixels, and converting from TIFF to JPEG format. North is to the upper right.")
Alt...
Mosaic of high-resolution LORRI images of Pluto, sent back from NASA's New Horizons spacecraft from Sept. 5 to 7, 2015. The image is dominated by the informally-named icy plain Sputnik Planum, the smooth, bright region across the center. This image also features a tremendous variety of other landscapes surrounding Sputnik. The smallest visible features are 0.5 miles (0.8 kilometers) in size, and the mosaic covers a region roughly 1,000 miles (1600 kilometers) wide. The image was taken as New Horizons flew past Pluto on July 14, 2015, from a distance of 50,000 miles (80,000 kilometers). The Johns Hopkins University Applied Physics Laboratory in Laurel, Maryland, designed, built, and operates the New Horizons spacecraft, and manages the mission for NASA's Science Mission Directorate. The Southwest Research Institute, based in San Antonio, leads the science team, payload operations and encounter science planning. New Horizons is part of the New Frontiers Program managed by NASA's Marshall Space Flight Center in Huntsville, Alabama. UPLOADER NOTES: The original NASA image has been modified by the uploader as follows: rotating clockwise 90°, extending the lower border by 154 pixels, and converting from TIFF to JPEG format. North is to the upper right.
Secrets Revealed from Pluto’s ‘Twilight Zone’
NASA's New Horizons spacecraft took this stunning image of Pluto only a few minutes after closest approach on July 14, 2015. The image was obtained at a high phase angle -- that is, with the sun on the other side of Pluto, as viewed by New Horizons. Seen here, sunlight filters through and illuminates Pluto's complex atmospheric haze layers. The southern portions of the nitrogen ice plains informally named Sputnik Planum, as well as mountains of the informally named Norgay Montes, can also be seen across Pluto's crescent at the top of the image.
Looking back at Pluto with images like this gives New Horizons scientists information about Pluto's hazes and surface properties that they can't get from images taken on approach. The image was obtained by New Horizons' Ralph/Multispectral Visual Imaging Camera (MVIC) approximately 13,400 miles (21,550 kilometers) from Pluto, about 19 minutes after New Horizons' closest approach. The image has a resolution of 1,400 feet (430 meters) per pixel. Pluto's diameter is 1,475 miles (2,374 kilometers).
[...]
Please read about the annotations in ALT-Text.
CREDIT
The Johns Hopkins University Applied Physics Laboratory in Laurel, Maryland, designed, built, and operates the New Horizons spacecraft, and manages the mission for NASA's Science Mission Directorate. The Southwest Research Institute, based in San Antonio, leads the science team, payload operations and encounter science planning. New Horizons is part of the New Frontiers Program managed by NASA's Marshall Space Flight Center in Huntsville, Alabama.
https://science.nasa.gov/photojournal/secrets-revealed-from-plutos-twilight-zone/
#space #pluto #astrophotography #photography #science #astronomy #physics #nature #NASA #education
 measuring tens of miles across that may be a discreet, low-lying cloud in Pluto's atmosphere; if so, it would be the only one yet identified in New Horizons imagery. This cloud -- if that's what it is -- is visible for the same reason the haze layers are so bright: illumination from the sunlight grazing Pluto's surface at a low angle. Atmospheric models suggest that methane clouds can occasionally form in Pluto's atmosphere. The scene in this inset is 140 miles (230 kilometers) across.
The inset at bottom right shows more detail on the night side of Pluto. This terrain can be seen because it is illuminated from behind by hazes that silhouette the of the annotated version limb. The topography here appears quite rugged, and broad valleys and sharp peaks with relief totaling 3 miles (5 kilometers) are apparent. This image, made from closer range, is much better than the lower-resolution images of this same terrain taken several days before closest approach. These silhouetted terrains therefore act as a useful \"anchor point,\" giving New Horizons scientists a rare, detailed glimpse at the lay of the land in this mysterious part of Pluto seen at high resolution only in twilight. The scene in this inset is 460 miles (750 kilometers) wide.")
Alt...
Annotated Version of image in previous post
The inset at top right in the annotated version shows a detail of Pluto's crescent, including an intriguing bright wisp (near the center) measuring tens of miles across that may be a discreet, low-lying cloud in Pluto's atmosphere; if so, it would be the only one yet identified in New Horizons imagery. This cloud -- if that's what it is -- is visible for the same reason the haze layers are so bright: illumination from the sunlight grazing Pluto's surface at a low angle. Atmospheric models suggest that methane clouds can occasionally form in Pluto's atmosphere. The scene in this inset is 140 miles (230 kilometers) across.
The inset at bottom right shows more detail on the night side of Pluto. This terrain can be seen because it is illuminated from behind by hazes that silhouette the of the annotated version limb. The topography here appears quite rugged, and broad valleys and sharp peaks with relief totaling 3 miles (5 kilometers) are apparent. This image, made from closer range, is much better than the lower-resolution images of this same terrain taken several days before closest approach. These silhouetted terrains therefore act as a useful "anchor point," giving New Horizons scientists a rare, detailed glimpse at the lay of the land in this mysterious part of Pluto seen at high resolution only in twilight. The scene in this inset is 460 miles (750 kilometers) wide.
![[?]](https://media.infosec.space/infosec-space/accounts/avatars/111/903/301/848/665/104/original/92fdee3f80aa1325.png)

@loganer Except "#AI" solely is being pushed as a #Bubble to #precariate #WageWork, increase #Theft from #Society to #Billionares and espechally #defund and #divest #PublicInfrastructure and #Education.
- Their theoretical benefits are clearly outweighted by their disadvantages - just like with CFC-11 & Tetraethyllead.
Calling an NPC an "AI" is far fetched given it's merely a #bot with a set list of rules to follow.
This clip of Orientale Basin was made with data from the Lunar Reconnaissance Orbiter by NASA's Scientific Visualization Studio.
Image credit: NASA’s Scientific Visualization Studio/Ernie Wright
https://moon.nasa.gov/observe-the-moon-night/participate/10-ways-to-observe-the-moon/
https://moon.nasa.gov/observe-the-moon-night/resources/moon-map/
#space #moon #astrophotography #photography #science #astronomy #nature #NASA #education
Join In!
The countdown is on.. for the International Observe the Moon Night 2025 on October 4!
https://moon.nasa.gov/observe-the-moon-night/
https://moon.nasa.gov/observe-the-moon-night/register/individual-participation/
#space #moon #astrophotography #photography #science #astronomy #nature #NASA #education
2025 October 4
The Rotating Moon
* Video Credit: NASA, Lunar Reconnaissance Orbiter, Arizona State U.
https://www.nasa.gov/
https://science.nasa.gov/mission/lro/
https://www.lroc.asu.edu/about/team
Explanation:
No one on Earth sees the Moon rotate like this. That's because the Moon is tidally locked in synchronous rotation, showing only one side to denizens of our fair planet. Still, given modern digital technology, combined with many detailed images returned by the Lunar Reconnaissance Orbiter (LRO), a high resolution virtual Moon rotation movie can be composed. In fact, the featured time-lapse video starts with a view of the familiar lunar nearside and quickly finds the Mare Orientale, a large crater with a dark center that is difficult to see from the Earth, rotating into view just below the equator. In a complete lunar rotation condensed into 24 seconds, the video clearly shows that the Earth-facing nearside of the Moon contains an abundance of dark lunar maria, while the lunar farside is dominated by bright lunar highlands. Of course you can just join other moon-watchers under hopefully clear skies tonight. Check out the sunlit portion of the lunar nearside on International Observe the Moon Night.
https://en.wikipedia.org/wiki/List_of_plains_on_the_Moon
https://en.wikipedia.org/wiki/Geology_of_the_Moon#Highlands
https://moon.nasa.gov/observe-the-moon-night/
https://lroc.im-ldi.com/about
https://apod.nasa.gov/apod/fap/ap251004.html
#space #moon #astrophotography #photography #science #astronomy #nature #NASA #education
The Moon’s Rotation
An enduring myth about the Moon is that it doesn't rotate. While it's true that the Moon keeps the same face to us, this only happens because the Moon rotates at the same rate as its orbital motion, a special case of tidal locking called synchronous rotation. The animation shows both the orbit and the rotation of the Moon. The yellow circle with the arrow and radial line have been added to make the rotation more apparent. The arrow indicates the direction of rotation. The radial line points to the center of the visible disk of the Moon at 0°N 0°E.
Credit:
NASA's Scientific Visualization Studio
Visualizer:
Ernie Wright (USRA)
Technical support
Laurence Schuler (ADNET Systems, Inc.)
Ian Jones (ADNET Systems, Inc.)
#space #moon #astrophotography #photography #science #astronomy #nature #NASA #education
So, the first step to resolving some of the educative issues around post-16 education was always going to be to de-emphasis the (arbitrary) target of 50% of all young people attending university...
So I welcome Keir Starmer's move away from that (although he has shifted to a wider, but still arbitrary target)... now all will depend on whether the promised rise in funding for Further Education arrives, is sustained & sufficient?
#FurtherEducation #education #politics
https://feweek.co.uk/fe-to-get-extra-800m-next-year-as-starmer-scraps-50-uni-target/
2025 October 1
NGC 6960: The Witch's Broom Nebula
* Image Credit & Copyright: Brian Meyers
Explanation:
Ten thousand years ago, before the dawn of recorded human history, a new light would suddenly have appeared in the night sky and faded after a few weeks. Today we know this light was from a supernova, or exploding star, and record the expanding debris cloud as the Veil Nebula, a supernova remnant. This sharp telescopic view is centered on a western segment of the Veil Nebula cataloged as NGC 6960 but less formally known as the Witch's Broom Nebula. Blasted out in the cataclysmic explosion, an interstellar shock wave plows through space sweeping up and exciting interstellar material. Imaged with narrow band filters, the glowing filaments are like long ripples in a sheet seen almost edge on, remarkably well separated into atomic hydrogen (red) and oxygen (blue-green) gas. The complete supernova remnant lies about 1400 light-years away towards the constellation Cygnus. This Witch's Broom actually spans about 35 light-years. The bright star in the frame is 52 Cygni, visible with the unaided eye from a dark location but unrelated to the ancient supernova remnant.
https://apod.nasa.gov/apod/ap251001.html
https://en.wikipedia.org/wiki/List_of_supernova_remnants
https://chandra.harvard.edu/xray_sources/supernovas.html
https://en.wikipedia.org/wiki/File:Cygnus_Loop_Labeled.png
https://apod.nasa.gov/apod/ap101119.html
https://apod.nasa.gov/apod/ap251001.html
#space #nebula #cluster #astrophotography #photography #science #astronomy #nature #NASA #ESA #education
 and oxygen (blue-green) gas. The complete supernova remnant lies about 1400 light-years away towards the constellation Cygnus. This Witch's Broom actually spans about 35 light-years. The bright star in the frame is 52 Cygni, visible with the unaided eye from a dark location but unrelated to the ancient supernova remnant.
Authors & editors: Robert Nemiroff (MTU) & Jerry Bonnell (UMCP)
NASA Official: Amber Straughn Specific rights apply.")
Alt...
2025 October 1
A starfield is shown that has a multi-filament nebula flowing across it horizontally. The most prominent colors are red and blue. Please see the explanation for more detailed information.
NGC 6960: The Witch's Broom Nebula
* Image Credit & Copyright: Brian Meyers
Explanation:
Ten thousand years ago, before the dawn of recorded human history, a new light would suddenly have appeared in the night sky and faded after a few weeks. Today we know this light was from a supernova, or exploding star, and record the expanding debris cloud as the Veil Nebula, a supernova remnant. This sharp telescopic view is centered on a western segment of the Veil Nebula cataloged as NGC 6960 but less formally known as the Witch's Broom Nebula. Blasted out in the cataclysmic explosion, an interstellar shock wave plows through space sweeping up and exciting interstellar material. Imaged with narrow band filters, the glowing filaments are like long ripples in a sheet seen almost edge on, remarkably well separated into atomic hydrogen (red) and oxygen (blue-green) gas. The complete supernova remnant lies about 1400 light-years away towards the constellation Cygnus. This Witch's Broom actually spans about 35 light-years. The bright star in the frame is 52 Cygni, visible with the unaided eye from a dark location but unrelated to the ancient supernova remnant.
Authors & editors: Robert Nemiroff (MTU) & Jerry Bonnell (UMCP)
NASA Official: Amber Straughn Specific rights apply.
![[?]](https://files.ohai.social/accounts/avatars/109/442/865/191/846/808/original/df60dbba9571ece4.png)
JSTOR now have a free account with an Independent Researcher category. You can access 100 documents per month. https://www.jstor.org/action/showLogin #research #education #science #history #economics 📚📘

![[?]](https://files.mastodon.social/accounts/avatars/115/033/912/889/256/727/original/5762f30d49ae6df1.jpeg)
I just conducted a training for teachers of a non-profit on AI and told them that AI isn't really thinking. They were so shocked.
We have to realize that non-technical folks will accept the marketing talk by the AI propagandists without question since they have no way to verify what they're saying.
2025 September 30
Comet Lemmon Brightens
* Image Credit & Copyright: Victor Sabet & Julien De Winter
https://app.astrobin.com/i/lsnen5
Explanation:
Comet Lemmon is brightening and moving into morning northern skies. Besides Comet SWAN25B and Comet ATLAS, Comet C/2025 A6 (Lemmon) is now the third comet currently visible with binoculars and on long camera exposures. Comet Lemmon was discovered early this year and is still headed into the inner Solar System. The comet will round the Sun on November 8, but first it will pass its nearest to the Earth -- at about half the Earth-Sun distance -- on October 21. Although the brightnesses of comets are notoriously hard to predict, optimistic estimates have Comet Lemmon then becoming visible to the unaided eye. The comet should be best seen in predawn skies until mid-October, when it also becomes visible in evening skies. The featured image showing the comet's split and rapidly changing ion tail was taken in Texas, USA late last week.
https://en.wikipedia.org/wiki/C/2025_A6_(Lemmon)
https://earthsky.org/space/5-bright-comets-approaching-earth-charts-2025-2026/
https://theskylive.com/c2025a6-info
https://science.nasa.gov/solar-system/comets/facts/
https://en.wikipedia.org/wiki/Comet_tail
https://en.wikipedia.org/wiki/Astronomical_unit
https://apod.nasa.gov/apod/ap250930.html
#space #comets #astrophotography #photography #science #astronomy #nature #NASA #ESA #education
 is now the third comet currently visible with binoculars and on long camera exposures. Comet Lemmon was discovered early this year and is still headed into the inner Solar System. The comet will round the Sun on November 8, but first it will pass its nearest to the Earth -- at about half the Earth-Sun distance -- on October 21. Although the brightnesses of comets are notoriously hard to predict, optimistic estimates have Comet Lemmon then becoming visible to the unaided eye. The comet should be best seen in predawn skies until mid-October, when it also becomes visible in evening skies. The featured image showing the comet's split and rapidly changing ion tail was taken in Texas, USA late last week.
Authors & editors: Robert Nemiroff (MTU) & Jerry Bonnell (UMCP)
NASA Official: Amber Straughn Specific rights apply.
NASA Web Privacy, Accessibility, Notices;
A service of: ASD at NASA / GSFC,
NASA Science Activation
& Michigan Tech. U.")
Alt...
2025 September 30
A starfield is shown that has a bright comet. The comet shows a green head on the lower left and an ion tail with significant structure extending out to the upper right.
Comet Lemmon Brightens
* Image Credit & Copyright: Victor Sabet & Julien De Winter
Explanation:
Comet Lemmon is brightening and moving into morning northern skies. Besides Comet SWAN25B and Comet ATLAS, Comet C/2025 A6 (Lemmon) is now the third comet currently visible with binoculars and on long camera exposures. Comet Lemmon was discovered early this year and is still headed into the inner Solar System. The comet will round the Sun on November 8, but first it will pass its nearest to the Earth -- at about half the Earth-Sun distance -- on October 21. Although the brightnesses of comets are notoriously hard to predict, optimistic estimates have Comet Lemmon then becoming visible to the unaided eye. The comet should be best seen in predawn skies until mid-October, when it also becomes visible in evening skies. The featured image showing the comet's split and rapidly changing ion tail was taken in Texas, USA late last week.
Authors & editors: Robert Nemiroff (MTU) & Jerry Bonnell (UMCP)
NASA Official: Amber Straughn Specific rights apply.
NASA Web Privacy, Accessibility, Notices;
A service of: ASD at NASA / GSFC,
NASA Science Activation
& Michigan Tech. U.
2025 September 29
Two Camera Comets in One Sky
* Image Credit & Copyright: Luc Perrot (TWAN)
https://www.lucperrot.fr/bio
Explanation:
It may look like these comets are racing, but they are not. Comets C/2025 K1 ATLAS (left) and C/2025 R2 SWAN (right) appeared near each other by chance last week in the featured image taken from France's Reunion Island in the southern Indian Ocean. Fainter Comet ATLAS is approaching our Sun and will reach its closest approach in early October when it is also expected to be its brightest -- although still only likely visible with long exposures on a camera. The brighter comet, nicknamed SWAN25B, is now headed away from our Sun, although its closest approach to Earth is expected in mid-October, when optimistic estimates have it becoming bright enough to see with the unaided eye. Each comet has a greenish coma of expelled gas and an ion tail pointing away from the Sun.
https://apod.nasa.gov/apod/ap250918.html
https://apod.nasa.gov/apod/ap250916.html
https://en.wikipedia.org/wiki/C/2025_K1_(ATLAS)
https://en.wikipedia.org/wiki/C/2025_R2_(SWAN)
https://en.wikipedia.org/wiki/Coma_(comet)
https://apod.nasa.gov/apod/ap250929.html
#space #comets #astrophotography #photography #science #astronomy #nature #NASA #ESA #education

Explanation:
It may look like these comets are racing, but they are not. Comets C/2025 K1 ATLAS (left) and C/2025 R2 SWAN (right) appeared near each other by chance last week in the featured image taken from France's Reunion Island in the southern Indian Ocean. Fainter Comet ATLAS is approaching our Sun and will reach its closest approach in early October when it is also expected to be its brightest -- although still only likely visible with long exposures on a camera. The brighter comet, nicknamed SWAN25B, is now headed away from our Sun, although its closest approach to Earth is expected in mid-October, when optimistic estimates have it becoming bright enough to see with the unaided eye. Each comet has a greenish coma of expelled gas and an ion tail pointing away from the Sun.
Authors & editors: Robert Nemiroff (MTU) & Jerry Bonnell (UMCP)
NASA Official: Amber Straughn Specific rights apply.
NASA Web Privacy, Accessibility, Notices;
A service of: ASD at NASA / GSFC,
NASA Science Activation
& Michigan Tech. U.")
Alt...
2025 September 29
A starfield is shown that has two short streaks running diagonally. At closer inspection, they are two comets both with white-green heads and white tails.
Two Camera Comets in One Sky
* Image Credit & Copyright: Luc Perrot (TWAN)
Explanation:
It may look like these comets are racing, but they are not. Comets C/2025 K1 ATLAS (left) and C/2025 R2 SWAN (right) appeared near each other by chance last week in the featured image taken from France's Reunion Island in the southern Indian Ocean. Fainter Comet ATLAS is approaching our Sun and will reach its closest approach in early October when it is also expected to be its brightest -- although still only likely visible with long exposures on a camera. The brighter comet, nicknamed SWAN25B, is now headed away from our Sun, although its closest approach to Earth is expected in mid-October, when optimistic estimates have it becoming bright enough to see with the unaided eye. Each comet has a greenish coma of expelled gas and an ion tail pointing away from the Sun.
Authors & editors: Robert Nemiroff (MTU) & Jerry Bonnell (UMCP)
NASA Official: Amber Straughn Specific rights apply.
NASA Web Privacy, Accessibility, Notices;
A service of: ASD at NASA / GSFC,
NASA Science Activation
& Michigan Tech. U.
Oct. 26, 2023
Distribution of Buried Ice on Mars
These Mars global maps show the likely distribution of water ice buried within the upper 3 feet (1 meter) of the planet's surface and represent the latest data from the Subsurface Water Ice Mapping project, or SWIM. SWIM uses data acquired by science instruments aboard three NASA orbital missions to estimate where ice may be hiding below the surface. Superimposed on the globes are the locations of ice-exposing meteoroid impacts, which provide an independent means to test the mapping results.
The ice-exposing impacts were spotted by the High-Resolution Imaging Science Experiment (HiRISE), a camera aboard NASA's Mars Reconnaissance Orbiter. While other instruments at Mars can only suggest where buried water ice is located, HiRISE's imagery of ice-exposing impacts can confirm where ice is present.
Most of these craters are no more than 33 feet (10 meters) in diameter, although in 2022 HiRISE captured a 492-foot-wide (150-meter-wide) impact crater that revealed a motherlode of ice that had been hiding beneath the surface. This crater is indicated with a circle in the upper-left portion of the right-most globe above.
Scientists can use mapping data like this to decide where the first astronauts on Mars should land: Buried ice will be a vital resource for the first people to set foot on Mars, serving as drinking water and a key ingredient for rocket fuel. It would also be a major scientific target: Astronauts or robots could one day drill ice cores much as scientists do on Earth, uncovering the climate history of Mars and exploring potential habitats (past or present) for microbial life.
Credit:
NASA Jet Propulsion Laboratory (JPL)
#space #mars #science #astronomy #physics #geology #nature #education #NASA
 of the planet's surface and represent the latest data from the Subsurface Water Ice Mapping project, or SWIM. SWIM uses data acquired by science instruments aboard three NASA orbital missions to estimate where ice may be hiding below the surface. Superimposed on the globes are the locations of ice-exposing meteoroid impacts, which provide an independent means to test the mapping results.
The need to look for subsurface ice arises because liquid water isn't stable on the Martian surface: The atmosphere is so thin that water immediately vaporizes. There's plenty of ice at the Martian poles – mostly made of water, although carbon dioxide, or dry ice, can be found as well – but those regions are too cold for astronauts (or robots) to survive for long.")
Alt...
Distribution of Buried Ice on Mars
Oct. 26, 2023
These Mars global maps show the likely distribution of water ice buried within the upper 3 feet (1 meter) of the planet's surface and represent the latest data from the Subsurface Water Ice Mapping project, or SWIM. SWIM uses data acquired by science instruments aboard three NASA orbital missions to estimate where ice may be hiding below the surface. Superimposed on the globes are the locations of ice-exposing meteoroid impacts, which provide an independent means to test the mapping results.
The need to look for subsurface ice arises because liquid water isn't stable on the Martian surface: The atmosphere is so thin that water immediately vaporizes. There's plenty of ice at the Martian poles – mostly made of water, although carbon dioxide, or dry ice, can be found as well – but those regions are too cold for astronauts (or robots) to survive for long.
![[?]](https://files.mastodon.social/accounts/avatars/113/594/284/246/350/110/original/c4fa29ebf91a45f2.png)
Pedagogies of Freedom: Critical and Emancipatory Perspectives on Education
Explore critical and alternative educational philosophies challenging traditional schooling. From social reproduction to holistic learning, and from radical thinkers to indigenous wisdom—engage with 19 insightful articles on emancipatory education. #CriticalPedagogy #Emancipation #AlternativeEducation #Education This collection presents 19 articles offering diverse perspectives on pedagogies of…
NISAR
Carrying an advanced radar system that will produce a dynamic, three-dimensional view of Earth in unprecedented detail, the NISAR (NASA-ISRO Synthetic Aperture Radar) satellite was launched from India on July 30, 2025. Jointly developed by NASA and the Indian Space Research Organisation (ISRO), the satellite can detect the movement of land and ice surfaces down to the centimeter. The mission will help protect communities by providing unique, actionable information to decision-makers in a diverse range of areas, including disaster response, infrastructure monitoring, and agricultural management.
https://science.nasa.gov/earth/
For more information on the NISAR mission, visit: https://nasa.gov/nisar.
Credit: NASA/JPL-Caltech; Additional media courtesy of USGS, ISRO, VDOS-URSC, and NPS, as marked; Earthquake imagery: NASA/JPL, N-SAIL, GeoGateway, SCEC, DOI 10.5967/5sq2-rs60, Google Earth; Licensed elements: volcano aerial footage (BlackBoxGuild/Shutterstock), flooded farmland (Vincent Film/MotionArray), helicopter over flooding (Retrofootage/Pond5)
#space #earth #astrophotography #photography #science #geology #nature #resources #climate #education

Alt...
A powerful new satellite will soon provide insights into natural hazards, ecosystems, agriculture, and other fields of study that affect communities around the globe. The NISAR mission is a collaboration between NASA and ISRO (Indian Space Research Organisation) and will use radar to track Earth’s changing surface in fine detail.
Short for NASA-ISRO Synthetic Aperture Radar, NISAR features an advanced radar system with two instruments: one from ISRO and one built at NASA’s Jet Propulsion Laboratory in Southern California. Using radar enables NISAR to map Earth’s land and ice surfaces day or night, regardless of whether skies are cloudy or clear.
NISAR will launch from ISRO’s Satish Dhawan Space Centre in Sriharikota, India. Launch is targeted for July 2025. Follow https://science.nasa.gov/blogs/nisar for the latest updates.
Credit: NASA/JPL-Caltech; Additional media courtesy of USGS, ISRO, VDOS-URSC, and NPS, as marked; Earthquake imagery: NASA/JPL, N-SAIL, GeoGateway, SCEC, DOI 10.5967/5sq2-rs60, Google Earth; Licensed elements: volcano aerial footage (BlackBoxGuild/Shutterstock), flooded farmland (Vincent Film/MotionArray), helicopter over flooding (Retrofootage/Pond5)
"All things share the same breath - the beast, the tree, the man. The air shares its spirit with all the life it supports."
-- Chief Seattle
Inside the Visualization: Aerosols
* Music Credit:
Universal Music Production: “Geology Spirals Instrumental” and “Collective Conscious Instrumental”
* Video Credits:
NASA's Goddard Space Flight Center
Emme Watkins (eMITS),
Kathleen Greer (GSFC AMA), Lesley Ott (HQ), Joseph V. Ardizzone (NASA/GSFC), Helen-Nicole Kostis (USRA)
Explanation:
NASA uses satellites, ground measurements, and powerful computer models to track tiny particles floating in our air called aerosols. These small particles can travel thousands of miles, affecting the air we breathe and how far we can see, even far from where they originated.
https://science.nasa.gov/earth/
#space #earth #astrophotography #photography #science #geology #nature #resources #climate #education
There are problems in development in reading skills among some secondary school pupils... but rather than look at the real problems in schools (from workforce management, to estate maintenance, from curriculum management to use fo social media & issues of student anxiety), the Govt. is rather considering yet another mandatory set of tests...
There's an old saying:
'you don't fatten a pig by weighting it'
Dawn of the Crab
* Image and Text Credit: Bradley E. Schaefer
https://www.lsu.edu/physics/people/faculty/schaefer.php
Explanation:
One of the all-time historic skyscapes occured in July 1054, when the Crab Supernova blazed into the dawn sky. Chinese court astrologers first saw the Guest Star on the morning of 4 July 1054 next to the star Tianguan (now cataloged as Zeta Tauri). The supernova peaked in late July 1054 a bit brighter than Venus, and was visible in the daytime for 23 days. The Guest Star was so bright that every culture around the world inevitably discovered the supernova independently, although only nine reports survive, including those from China, Japan, and Constantinople. This iPhone picture is from Signal Hill near Tucson on the morning of 26 July 2025, faithfully re-creates the year 1054 Dawn of the Crab, showing the sky as seen by Hohokam peoples. The planet Venus, as a stand-in for the supernova, is close to the position of what is now the Crab Nebula supernova remnant. Step outside on a summer dawn with bright Venus, and ask yourself "What would you have thought in ancient times when suddenly seeing the Dawn of the Crab?"
+ Crab Nebula:
https://en.wikipedia.org/wiki/SN_1054
https://apod.nasa.gov/apod/ap011227.html
+ Zeta Tauri:
https://www.star-facts.com/tianguan-zeta-tauri/
http://stars.astro.illinois.edu/sow/zetatau.html
+ Astrophysics:
https://ui.adsabs.harvard.edu/abs/2003LNP...598..195P/abstract
+ History:
https://ui.adsabs.harvard.edu/abs/2003LNP...598....7G/abstract
https://www.kyohaku.go.jp/eng/learn/home/dictio/shoseki/sadaie/
https://www.nytimes.com/1978/07/18/archives/old-text-is-linked-to-1054-supernova-scientific-journal-tells-of.html
+ Hystorical Chinese Astrology:
https://www.lehigh.edu/~dwp0/Assets/images/astroorigins.pdf
+ Cultural:
https://www.britannica.com/topic/Hohokam-culture
https://www.nps.gov/articles/000/signal-hill-petroglyphs.htm
+ Education:
https://spaceplace.nasa.gov/supernova/en/
https://apod.nasa.gov/apod/ap250808.html
#space_related #astrophotography #photography #science #history #astronomy #astrology #nature #NASA #culture #literature #education #Space_Culture_Club

2025 August 8
Dawn of the Crab
* Image and Text Credit: Bradley E. Schaefer
Explanation:
One of the all-time historic skyscapes occured in July 1054, when the Crab Supernova blazed into the dawn sky. Chinese court astrologers first saw the Guest Star on the morning of 4 July 1054 next to the star Tianguan (now cataloged as Zeta Tauri). The supernova peaked in late July 1054 a bit brighter than Venus, and was visible in the daytime for 23 days. The Guest Star was so bright that every culture around the world inevitably discovered the supernova independently, although only nine reports survive, including those from China, Japan, and Constantinople. This iPhone picture is from Signal Hill near Tucson on the morning of 26 July 2025, faithfully re-creates the year 1054 Dawn of the Crab, showing the sky as seen by Hohokam peoples. The planet Venus, as a stand-in for the supernova, is close to the position of what is now the Crab Nebula supernova remnant. Step outside on a summer dawn with bright Venus, and ask yourself \"What would you have thought in ancient times when suddenly seeing the Dawn of the Crab?\"
Authors & editors: Robert Nemiroff (MTU) & Jerry Bonnell (UMCP)
NASA Official: Amber Straughn Specific rights apply.
NASA Web Privacy, Accessibility, Notices;
A service of: ASD at NASA / GSFC,
NASA Science Activation
& Michigan Tech. U.")
Alt...
The Dawn Sky Of 26 July 1054 AD (with annotations)
2025 August 8
Dawn of the Crab
* Image and Text Credit: Bradley E. Schaefer
Explanation:
One of the all-time historic skyscapes occured in July 1054, when the Crab Supernova blazed into the dawn sky. Chinese court astrologers first saw the Guest Star on the morning of 4 July 1054 next to the star Tianguan (now cataloged as Zeta Tauri). The supernova peaked in late July 1054 a bit brighter than Venus, and was visible in the daytime for 23 days. The Guest Star was so bright that every culture around the world inevitably discovered the supernova independently, although only nine reports survive, including those from China, Japan, and Constantinople. This iPhone picture is from Signal Hill near Tucson on the morning of 26 July 2025, faithfully re-creates the year 1054 Dawn of the Crab, showing the sky as seen by Hohokam peoples. The planet Venus, as a stand-in for the supernova, is close to the position of what is now the Crab Nebula supernova remnant. Step outside on a summer dawn with bright Venus, and ask yourself "What would you have thought in ancient times when suddenly seeing the Dawn of the Crab?"
Authors & editors: Robert Nemiroff (MTU) & Jerry Bonnell (UMCP)
NASA Official: Amber Straughn Specific rights apply.
NASA Web Privacy, Accessibility, Notices;
A service of: ASD at NASA / GSFC,
NASA Science Activation
& Michigan Tech. U.
")
Alt...
The Dawn Sky Of 26 July 2025 AD (with annotations)
![[?]](https://static.partyon.xyz/accounts/avatars/113/433/263/637/532/789/original/9d13d5d5c112d507.jpg)
The #UnitedStates is the only place on #earth where poor #people shun #unions, free #healthcare, and free #education because the #rich tell them to.

Alt...
The United States is the only place on earth where poor people shun unions, free healthcare, and free education because the rich tell them to.