Search results for tag #nasa
![[?]](https://files.defcon.social/dcsocial-s3/accounts/avatars/113/208/344/507/078/943/original/014820ad22daee1c.jpg)
Der Mond ist aufgegangen
Die goldnen Sternlein prangen
Am Himmel hell und klar:
Der Wald steht schwarz und schweiget,
Und aus den Wiesen steiget
Der weiße Nebel wunderbar.
The moon is risen, beaming,
The golden stars are gleaming
So brightly in the skies;
The hushed, black woods are dreaming,
The mists, like phantoms seeming,
From meadows magically rise.
* 1st verse of the song "Der Mond ist aufgegangen" by Matthias Claudius translated by Margarete Münsterberg
https://en.wikipedia.org/wiki/Der_Mond_ist_aufgegangen.
Welcome back to the weekend full moon topic and have a nice and relaxed evening! 🌕 🔭
2022 June 16
Strawberry Supermoon from China
* Image Credit & Copyright: Jeff Dai (TWAN)
https://twanight.org/profile/jeff-dai/
Explanation:
There were four Full Supermoons in 2022. Using the definition of a supermoon as a Full Moon near perigee, that is within at least 90% of its closest approach to Earth in a given orbit, the year's Full Supermoon dates were May 16, June 14, July 13, and August 12. Full Moons near perigee really are the brightest and largest in planet Earth's sky. But size and brightness differences between Full Moons are relatively small and an actual comparison with other Full Moons is difficult to make by eye alone. Two exposures are blended in this supermoon and sky view from June 14. That Full Moon was also known to northern hemisphere skygazers as the Strawberry moon. The consecutive short and long exposures allow familiar features on the fully sunlit lunar nearside to be seen in the same image as a faint lunar corona and an atmospheric cloudscape. They were captured in skies over Chongqing, China.
https://apod.nasa.gov/apod/ap220616.html
#space #earth #moon #atmosphere #astrophotography #photography #science #astronomy #nature #NASA

Explanation:
There were four Full Supermoons in 2022. Using the definition of a supermoon as a Full Moon near perigee, that is within at least 90% of its closest approach to Earth in a given orbit, the year's Full Supermoon dates were May 16, June 14, July 13, and August 12. Full Moons near perigee really are the brightest and largest in planet Earth's sky. But size and brightness differences between Full Moons are relatively small and an actual comparison with other Full Moons is difficult to make by eye alone. Two exposures are blended in this supermoon and sky view from June 14. That Full Moon was also known to northern hemisphere skygazers as the Strawberry moon. The consecutive short and long exposures allow familiar features on the fully sunlit lunar nearside to be seen in the same image as a faint lunar corona and an atmospheric cloudscape. They were captured in skies over Chongqing, China.
Authors & editors: Robert Nemiroff (MTU) & Jerry Bonnell (UMCP)
NASA Official: Phillip Newman Specific rights apply.
NASA Web Privacy Policy and Important Notices
A service of: ASD at NASA / GSFC
& Michigan Tech. U.")
Alt...
2022 June 16
Strawberry Supermoon from China
* Image Credit & Copyright: Jeff Dai (TWAN)
Explanation:
There were four Full Supermoons in 2022. Using the definition of a supermoon as a Full Moon near perigee, that is within at least 90% of its closest approach to Earth in a given orbit, the year's Full Supermoon dates were May 16, June 14, July 13, and August 12. Full Moons near perigee really are the brightest and largest in planet Earth's sky. But size and brightness differences between Full Moons are relatively small and an actual comparison with other Full Moons is difficult to make by eye alone. Two exposures are blended in this supermoon and sky view from June 14. That Full Moon was also known to northern hemisphere skygazers as the Strawberry moon. The consecutive short and long exposures allow familiar features on the fully sunlit lunar nearside to be seen in the same image as a faint lunar corona and an atmospheric cloudscape. They were captured in skies over Chongqing, China.
Authors & editors: Robert Nemiroff (MTU) & Jerry Bonnell (UMCP)
NASA Official: Phillip Newman Specific rights apply.
NASA Web Privacy Policy and Important Notices
A service of: ASD at NASA / GSFC
& Michigan Tech. U.
"Ah Bella Italia! Let's linger a little longer in the beautiful Mediterranean south of this country, whose people are so particularly warm and lovable, and treat ourselves to the sight of this fantastic "Harvest Moon". Inevitably, I remember the famous song by Neil Young and that yesterday I uploaded a folk version of it, which, despite its great charm, received little attention from you. Maybe yesterday it was already too late for that and we have better luck today .."
https://defcon.social/@grobi/114842524039878298
2022 September 15
Harvest Moon over Sicily
* Image Credit & Copyright: Dario Giannobile
https://www.dariogiannobile.com/
Explanation:
For northern hemisphere dwellers, September's Full Moon was the Harvest Moon. Reflecting warm hues at sunset it rises over the historic town of Castiglione di Sicilia in this telephoto view from September 9. Famed in festival, story, and song Harvest Moon is just the traditional name of the full moon nearest the autumnal equinox. According to lore the name is a fitting one. Despite the diminishing daylight hours as the growing season drew to a close, farmers could harvest crops by the light of a full moon shining on from dusk to dawn.
https://apod.nasa.gov/apod/ap220915.html
#space #earth #moon #atmosphere #astrophotography #photography #science #astronomy #nature #NASA #italy
 & Jerry Bonnell (UMCP)
NASA Official: Phillip Newman Specific rights apply.
NASA Web Privacy Policy and Important Notices
A service of: ASD at NASA / GSFC,
NASA Science Activation
& Michigan Tech. U.")
Alt...
2022 September 15
Harvest Moon over Sicily
* Image Credit & Copyright: Dario Giannobile
Explanation:
For northern hemisphere dwellers, September's Full Moon was the Harvest Moon. Reflecting warm hues at sunset it rises over the historic town of Castiglione di Sicilia in this telephoto view from September 9. Famed in festival, story, and song Harvest Moon is just the traditional name of the full moon nearest the autumnal equinox. According to lore the name is a fitting one. Despite the diminishing daylight hours as the growing season drew to a close, farmers could harvest crops by the light of a full moon shining on from dusk to dawn.
Authors & editors: Robert Nemiroff (MTU) & Jerry Bonnell (UMCP)
NASA Official: Phillip Newman Specific rights apply.
NASA Web Privacy Policy and Important Notices
A service of: ASD at NASA / GSFC,
NASA Science Activation
& Michigan Tech. U.
2022 August 18
Full Moon Perseids
* Image Credit & Copyright: Juan Carlhttps://twanight.org/profile/juan-carlos-casado/os Casado (Starry Earth, TWAN)
https://twanight.org/profile/juan-carlos-casado/
Explanation:
The annual Perseid meteor shower was near its peak on 2022 August 13. As planet Earth crossed through streams of debris left by periodic Comet Swift-Tuttle meteors rained in northern summer night skies. But even that night's nearly Full Moon shining near the top of this composited view couldn't hide all of the popular shower's meteor streaks. The image captures some of the brightest perseid meteors in many short exposures recorded over more than two hours before the dawn. It places the shower's radiant in the heroic constellation of Perseus just behind a well-lit medieval tower in the village of Sant Llorenc de la Muga, Girona, Spain. Observed in medieval times, the Perseid meteor shower is also known in Catholic tradition as the Tears of St. Lawrence, and festivities are celebrated close to the annual peak of the meteor shower. Joining the Full Moon opposite the Sun, bright planet Saturn also shines in the frame at the upper right.
https://apod.nasa.gov/apod/ap220818.html
#space #earth #moon #atmosphere #astrophotography #photography #science #astronomy #nature #NASA

Explanation:
The annual Perseid meteor shower was near its peak on August 13. As planet Earth crossed through streams of debris left by periodic Comet Swift-Tuttle meteors rained in northern summer night skies. But even that night's nearly Full Moon shining near the top of this composited view couldn't hide all of the popular shower's meteor streaks. The image captures some of the brightest perseid meteors in many short exposures recorded over more than two hours before the dawn. It places the shower's radiant in the heroic constellation of Perseus just behind a well-lit medieval tower in the village of Sant Llorenc de la Muga, Girona, Spain. Observed in medieval times, the Perseid meteor shower is also known in Catholic tradition as the Tears of St. Lawrence, and festivities are celebrated close to the annual peak of the meteor shower. Joining the Full Moon opposite the Sun, bright planet Saturn also shines in the frame at the upper right.
Authors & editors: Robert Nemiroff (MTU) & Jerry Bonnell (UMCP)
NASA Official: Phillip Newman Specific rights apply.
NASA Web Privacy Policy and Important Notices
A service of: ASD at NASA / GSFC,
NASA Science Activation
& Michigan Tech. U.")
Alt...
2022 August 18
Full Moon Perseids
* Image Credit & Copyright: Juan Carlos Casado (Starry Earth, TWAN)
Explanation:
The annual Perseid meteor shower was near its peak on August 13. As planet Earth crossed through streams of debris left by periodic Comet Swift-Tuttle meteors rained in northern summer night skies. But even that night's nearly Full Moon shining near the top of this composited view couldn't hide all of the popular shower's meteor streaks. The image captures some of the brightest perseid meteors in many short exposures recorded over more than two hours before the dawn. It places the shower's radiant in the heroic constellation of Perseus just behind a well-lit medieval tower in the village of Sant Llorenc de la Muga, Girona, Spain. Observed in medieval times, the Perseid meteor shower is also known in Catholic tradition as the Tears of St. Lawrence, and festivities are celebrated close to the annual peak of the meteor shower. Joining the Full Moon opposite the Sun, bright planet Saturn also shines in the frame at the upper right.
Authors & editors: Robert Nemiroff (MTU) & Jerry Bonnell (UMCP)
NASA Official: Phillip Newman Specific rights apply.
NASA Web Privacy Policy and Important Notices
A service of: ASD at NASA / GSFC,
NASA Science Activation
& Michigan Tech. U.
Let's get a little inspiration as we walk on this beach at night ..
2024 March 11
A Full Plankton Moon
* Credit & Copyright: Petr Horálek / Institute of Physics in Opava
https://www.petrhoralek.com/#about-1
https://www.slu.cz/phys/en/
Explanation:
What glows in the night? This night featured a combination of usual and unusual glows. Perhaps the most usual glow was from the Moon, a potentially familiar object. The full Moon's nearly vertical descent results from the observer being near Earth's equator. As the Moon sets, air and aerosols in Earth's atmosphere preferentially scatter out blue light, making the Sun-reflecting satellite appear reddish when near the horizon. Perhaps the most unusual glow was from the bioluminescent plankton, likely less familiar objects. These microscopic creatures glow blue, it is thought, primarily to surprise and deter predators. In this case, the glow was caused primarily by plankton-containing waves crashing onto the beach. The image was taken on Soneva Fushi Island, Maldives just over one year ago.
https://apod.nasa.gov/apod/ap240311.html
#space #earth #moon #atmosphere #astrophotography #photography #science #astronomy #physics #nature #NASA
 & Jerry Bonnell (UMCP)
NASA Official: Amber Straughn; Specific rights apply.
NASA Web Privacy Policy and Important Notices
A service of: ASD at NASA / GSFC,
NASA Science Activation")
Alt...
2024 March 11
Several images of a full moon setting are superposed. The moon images are nearly white near the top, but turn orange and then are covered by low clouds near the horizon. Unusually, the setting moon images line up almost vertically. In the foreground is a beach with waves illuminated by blue-glowing plankton.
A Full Plankton Moon
* Credit & Copyright: Petr Horálek / Institute of Physics in Opava
Explanation:
What glows in the night? This night featured a combination of usual and unusual glows. Perhaps the most usual glow was from the Moon, a potentially familiar object. The full Moon's nearly vertical descent results from the observer being near Earth's equator. As the Moon sets, air and aerosols in Earth's atmosphere preferentially scatter out blue light, making the Sun-reflecting satellite appear reddish when near the horizon. Perhaps the most unusual glow was from the bioluminescent plankton, likely less familiar objects. These microscopic creatures glow blue, it is thought, primarily to surprise and deter predators. In this case, the glow was caused primarily by plankton-containing waves crashing onto the beach. The image was taken on Soneva Fushi Island, Maldives just over one year ago.
Authors & editors: Robert Nemiroff (MTU) & Jerry Bonnell (UMCP)
NASA Official: Amber Straughn; Specific rights apply.
NASA Web Privacy Policy and Important Notices
A service of: ASD at NASA / GSFC,
NASA Science Activation
2024 June 29
A Solstice Moon
* Image Credit & Copyright: Tunc Tezel (TWAN)
https://twanight.org/profile/tunc-tezel/
Explanation:
Rising opposite the setting Sun, June's Full Moon occurred within about 28 hours of the solstice. The Moon stays close to the Sun's path along the ecliptic plane and so while the solstice Sun climbed high in daytime skies, June's Full Moon remained low that night as seen from northern latitudes. In fact, the Full Moon hugs the horizon in this June 21 rooftop night sky view from Bursa, Turkey, constructed from exposures made every 10 minutes between moonrise and moonset. In 2024 the Moon also reached a major lunar standstill, an extreme in the monthly north-south range of moonrise and moonset caused by the precession of the Moon's orbit over an 18.6 year cycle. As a result, this June solstice Full Moon was at its southernmost moonrise and moonset along the horizon.
https://apod.nasa.gov/apod/ap240629.html
#space #earth #moon #atmosphere #astrophotography #photography #science #astronomy #nature #NASA

Explanation:
Rising opposite the setting Sun, June's Full Moon occurred within about 28 hours of the solstice. The Moon stays close to the Sun's path along the ecliptic plane and so while the solstice Sun climbed high in daytime skies, June's Full Moon remained low that night as seen from northern latitudes. In fact, the Full Moon hugs the horizon in this June 21 rooftop night sky view from Bursa, Turkey, constructed from exposures made every 10 minutes between moonrise and moonset. In 2024 the Moon also reached a major lunar standstill, an extreme in the monthly north-south range of moonrise and moonset caused by the precession of the Moon's orbit over an 18.6 year cycle. As a result, this June solstice Full Moon was at its southernmost moonrise and moonset along the horizon.
Authors & editors: Robert Nemiroff (MTU) & Jerry Bonnell (UMCP)
NASA Official: Amber Straughn Specific rights apply.
NASA Web Privacy, Accessibility Notices
A service of: ASD at NASA / GSFC,
NASA Science Activation
& Michigan Tech. U.")
Alt...
2024 June 29
A Solstice Moon
* Image Credit & Copyright: Tunc Tezel (TWAN)
Explanation:
Rising opposite the setting Sun, June's Full Moon occurred within about 28 hours of the solstice. The Moon stays close to the Sun's path along the ecliptic plane and so while the solstice Sun climbed high in daytime skies, June's Full Moon remained low that night as seen from northern latitudes. In fact, the Full Moon hugs the horizon in this June 21 rooftop night sky view from Bursa, Turkey, constructed from exposures made every 10 minutes between moonrise and moonset. In 2024 the Moon also reached a major lunar standstill, an extreme in the monthly north-south range of moonrise and moonset caused by the precession of the Moon's orbit over an 18.6 year cycle. As a result, this June solstice Full Moon was at its southernmost moonrise and moonset along the horizon.
Authors & editors: Robert Nemiroff (MTU) & Jerry Bonnell (UMCP)
NASA Official: Amber Straughn Specific rights apply.
NASA Web Privacy, Accessibility Notices
A service of: ASD at NASA / GSFC,
NASA Science Activation
& Michigan Tech. U.
2021 December 4
Iridescent by Moonlight
* Image Credit & Copyright: Marcella Giulia Pace
https://greenflash.photo/about-me/
Explanation:
In this snapshot from November 18, the Full Moon was not far from Earth's shadow. In skies over Sicily the brightest lunar phase was eclipsed by passing clouds though. The full moonlight was dimmed and momentarily diffracted by small but similar sized water droplets near the edges of the high thin clouds. The resulting iridescence shines with colors like a lunar corona. On that night, the Full Moon was also seen close to the Pleiades star cluster appearing at the lower left of the iridescent cloud bank. The stars of the Seven Sisters were soon to share the sky with a darker, reddened lunar disk.
https://apod.nasa.gov/apod/ap211204.html
#space #earth #moon #atmosphere #astrophotography #photography #science #astronomy #nature #NASA
 & Jerry Bonnell (UMCP)
NASA Official: Phillip Newman Specific rights apply.
NASA Web Privacy Policy and Important Notices
A service of: ASD at NASA / GSFC
& Michigan Tech. U.")
Alt...
2021 December 4
Iridescent by Moonlight
* Image Credit & Copyright: Marcella Giulia Pace
Explanation:
In this snapshot from November 18, the Full Moon was not far from Earth's shadow. In skies over Sicily the brightest lunar phase was eclipsed by passing clouds though. The full moonlight was dimmed and momentarily diffracted by small but similar sized water droplets near the edges of the high thin clouds. The resulting iridescence shines with colors like a lunar corona. On that night, the Full Moon was also seen close to the Pleiades star cluster appearing at the lower left of the iridescent cloud bank. The stars of the Seven Sisters were soon to share the sky with a darker, reddened lunar disk.
Authors & editors: Robert Nemiroff (MTU) & Jerry Bonnell (UMCP)
NASA Official: Phillip Newman Specific rights apply.
NASA Web Privacy Policy and Important Notices
A service of: ASD at NASA / GSFC
& Michigan Tech. U.
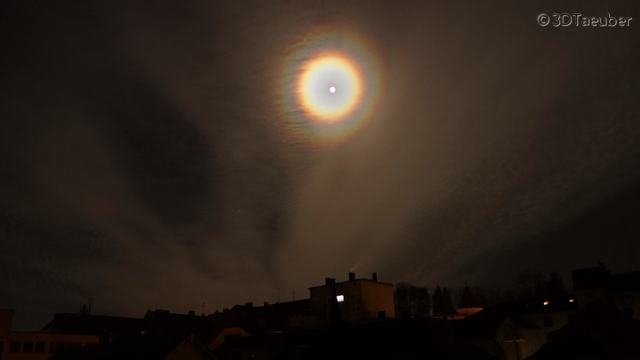
2015 June 15
A Colorful Lunar Corona
* Image Credit & Copyright: Sergio Montúfar , Planetario Ciudad de La Plata
https://www.ferventastronomy.com/Gallery/BrandAmbassadors/SergioMontufar/
https://planetario.unlp.edu.ar/
Explanation:
What are those colorful rings around the Moon? A corona. Rings like this will sometimes appear when the Moon is seen through thin clouds. The effect is created by the quantum mechanical diffraction of light around individual, similarly-sized water droplets in an intervening but mostly-transparent cloud. Since light of different colors has different wavelengths, each color diffracts differently. Lunar Coronae are one of the few quantum mechanical color effects that can be easily seen with the unaided eye. The featured lunar corona was captured around a Strawberry Moon on June 2 from La Plata, Argentina. Similar coronae that form around the Sun are typically harder to see because of the Sun's great brightness.
https://en.wikipedia.org/wiki/Corona_(optical_phenomenon)
https://youtu.be/r_nPQcfxhOM
https://www.atoptics.co.uk/blog/corona-formation/
https://en.wikipedia.org/wiki/Diffraction
https://www.youtube.com/watch?v=fgiOjqTiwn8
https://physics.stackexchange.com/questions/65397/quantum-mechanics-and-everyday-nature
https://epod.usra.edu/blog/2014/02/coronas-around-the-moon.html
https://apod.nasa.gov/apod/ap150615.html
#space #earth #moon #atmosphere #astrophotography #photography #science #astronomy #physics #quantummechanic #nature #NASA
 & Jerry Bonnell (UMCP)
NASA Official: Phillip Newman Specific rights apply.
NASA Web Privacy Policy and Important Notices
A service of: ASD at NASA / GSFC")
Alt...
2015 June 15
A Colorful Lunar Corona
* Image Credit & Copyright: Sergio Montúfar , Planetario Ciudad de La Plata
Explanation:
What are those colorful rings around the Moon? A corona. Rings like this will sometimes appear when the Moon is seen through thin clouds. The effect is created by the quantum mechanical diffraction of light around individual, similarly-sized water droplets in an intervening but mostly-transparent cloud. Since light of different colors has different wavelengths, each color diffracts differently. Lunar Coronae are one of the few quantum mechanical color effects that can be easily seen with the unaided eye. The featured lunar corona was captured around a Strawberry Moon on June 2 from La Plata, Argentina. Similar coronae that form around the Sun are typically harder to see because of the Sun's great brightness.
Authors & editors: Robert Nemiroff (MTU) & Jerry Bonnell (UMCP)
NASA Official: Phillip Newman Specific rights apply.
NASA Web Privacy Policy and Important Notices
A service of: ASD at NASA / GSFC
Video of the lunar corona around the blood moon of 2015 April 4.
If you look closely, you can see not only the lunar corona but also that the structure of the higher clouds is influenced by the gravitational wave effect.
.. and last but not least the ISS crossing the sky ..
VIDEO CREDIT
Nature 3D Taeuber
https://www.youtube.com/watch?v=fgiOjqTiwn8
#space #earth #moon #atmosphere #astrophotography #photography #science #astronomy #physics #quantummechanic #nature #NASA
Alt...
Video of the lunar corona around the blood moon of 2015 April 4.
VIDEO CREDIT
Nature 3D Taeuber
2025 August 23
Fishing for the Moon
* Image Credit & Copyright: Marco Bellelli
Explanation:
How big is planet Earth's Moon? Compared to other moons of the Solar System, it's number 5 on the largest to smallest ranked list, following Jupiter's moon Ganymede, Saturn's moon Titan, and Jovian moons Callisto and Io. Continuing the list, the Moon comes before Jupiter's Europa and Neptune's Triton. It's also larger than dwarf planets Pluto and Eris. With a diameter of 3,475 kilometers the Moon is about 1/4 the size of Earth though, and that does make it the largest moon when compared to the size of its parent Solar System planet. Of course in this serene, twilight sea and skyscape, August's rising Full Moon still appears small enough to be caught in the nets of an ancient fishing rig. The telephoto snapshot was taken along the Italian Costa dei Trabocchi, on the Adriatic Sea.
https://science.nasa.gov/moon/facts/
https://en.wikipedia.org/wiki/List_of_Solar_System_objects_by_size
https://apod.nasa.gov/apod/ap231128.html
https://apod.nasa.gov/apod/ap250503.html
https://apod.nasa.gov/apod/ap020120.html
https://apod.nasa.gov/apod/ap240329.html
https://apod.nasa.gov/apod/ap231023.html
https://apod.nasa.gov/apod/ap140826.html
https://apod.nasa.gov/apod/ap250823.html
#space #earth #moon #astrophotography #photography #science #astronomy #nature #NASA
 & Jerry Bonnell (UMCP)
NASA Official: Amber Straughn Specific rights apply.
NASA Web Privacy, Accessibility, Notices;
A service of: ASD at NASA / GSFC,
NASA Science Activation
& Michigan Tech. U.")
Alt...
2025 August 23
Fishing for the Moon
* Image Credit & Copyright: Marco Bellelli
Explanation:
How big is planet Earth's Moon? Compared to other moons of the Solar System, it's number 5 on the largest to smallest ranked list, following Jupiter's moon Ganymede, Saturn's moon Titan, and Jovian moons Callisto and Io. Continuing the list, the Moon comes before Jupiter's Europa and Neptune's Triton. It's also larger than dwarf planets Pluto and Eris. With a diameter of 3,475 kilometers the Moon is about 1/4 the size of Earth though, and that does make it the largest moon when compared to the size of its parent Solar System planet. Of course in this serene, twilight sea and skyscape, August's rising Full Moon still appears small enough to be caught in the nets of an ancient fishing rig. The telephoto snapshot was taken along the Italian Costa dei Trabocchi, on the Adriatic Sea.
Authors & editors: Robert Nemiroff (MTU) & Jerry Bonnell (UMCP)
NASA Official: Amber Straughn Specific rights apply.
NASA Web Privacy, Accessibility, Notices;
A service of: ASD at NASA / GSFC,
NASA Science Activation
& Michigan Tech. U.
2025 October 8
NGC 7380: The Wizard Nebula
* Images Credit & Copyright: Nevenka Blagovic Horvat & Miroslav Horvat
https://www.instagram.com/miroslav.horvat/
https://www.flickr.com/people/miroslav1/
Explanation:
What powers are being wielded in the Wizard Nebula? Gravitation strong enough to form stars, and stellar winds and radiations powerful enough to create and dissolve towers of gas. Located only 8,000 light years away, the Wizard nebula, featured here, surrounds developing open star cluster NGC 7380. Visually, the interplay of stars, gas, and dust has created a shape that appears to some like a fictional medieval sorcerer. The active star forming region spans about 100 light years, making it appear larger than the angular extent of the Moon. The Wizard Nebula can be located with a small telescope toward the constellation of the King of Aethiopia (Cepheus). Although the nebula may last only a few million years, some of the stars being formed may outlive our Sun.
https://en.wikipedia.org/wiki/Magician_(fantasy)#/media/File:Saluzzo-Castello_della_Manta-mago.jpg
https://en.wikipedia.org/wiki/NGC_7380
https://ui.adsabs.harvard.edu/abs/2011AJ....142...71C/abstract
https://ui.adsabs.harvard.edu/abs/2011AJ....142...71C/abstract
https://lco.global/spacebook/sky/using-angles-describe-positions-and-apparent-sizes-objects/
https://apod.nasa.gov/apod/ap251008.html
#space #nebula #cluster #astrophotography #photography #science #astronomy #nature #NASA #ESA #apod #education
. Although the nebula may last only a few million years, some of the stars being formed may outlive our Sun.
Authors & editors: Robert Nemiroff (MTU) & Jerry Bonnell (UMCP)
NASA Official: Amber Straughn Specific rights apply.
NASA Web Privacy, Accessibility, Notices;
A service of: ASD at NASA / GSFC,
NASA Science Activation
& Michigan Tech. U.")
Alt...
2025 October 8
A starfield is shown surrounding a bright gaseous nebula in red with bits of white and blue. Pillars of dust and gas appear around the interior of the nebula pointing to energetic stars in a cluster in the nebula. Please see the explanation for more detailed information.
NGC 7380: The Wizard Nebula
* Images Credit & Copyright: Nevenka Blagovic Horvat & Miroslav Horvat
Explanation:
What powers are being wielded in the Wizard Nebula? Gravitation strong enough to form stars, and stellar winds and radiations powerful enough to create and dissolve towers of gas. Located only 8,000 light years away, the Wizard nebula, featured here, surrounds developing open star cluster NGC 7380. Visually, the interplay of stars, gas, and dust has created a shape that appears to some like a fictional medieval sorcerer. The active star forming region spans about 100 light years, making it appear larger than the angular extent of the Moon. The Wizard Nebula can be located with a small telescope toward the constellation of the King of Aethiopia (Cepheus). Although the nebula may last only a few million years, some of the stars being formed may outlive our Sun.
Authors & editors: Robert Nemiroff (MTU) & Jerry Bonnell (UMCP)
NASA Official: Amber Straughn Specific rights apply.
NASA Web Privacy, Accessibility, Notices;
A service of: ASD at NASA / GSFC,
NASA Science Activation
& Michigan Tech. U.
2025 October 7
SN Encore: A Second Supernova Seen Several Times
* Images Credit:
+ Webb (main): NASA, ESA, CSA, STScI, J. Pierel (STScI) & A. Newman (Carnegie Inst. for Science)
https://science.nasa.gov/mission/webb/
https://www.esa.int/
https://www.asc-csa.gc.ca/
https://www.stsci.edu/
https://www.linkedin.com/in/justinr3
https://carnegiescience.edu/bio/dr-andrew-newman
https://carnegiescience.edu/
+ Hubble (rollover): NASA, ESA, STScI, S. A. Rodney (U. South Carolina) & G. Brammer (NBI, U. Copenhagen)
https://science.nasa.gov/mission/hubble/
https://sc.edu/uofsc/posts/2018/08/garnet_apple_steven_rodney.php
https://sc.edu/study/colleges_schools/artsandsciences/physics_and_astronomy/
https://nbi.ku.dk/english/staff/?pure=en/persons/625553
https://nbi.ku.dk/
Explanation:
Now a second supernova in this same galaxy is repeating. The cause is the gravitational lens effect of a massive foreground cluster of galaxies (MACS J0138) -- it creates multiple images of a perfectly aligned background galaxy (MRG-M0138). What's particularly interesting is that this background galaxy has young stars that keep blowing up. And images of each supernova explosion keep coming to us multiple times through different paths through the cluster. The original lensed supernova set, shown in the rollover, is called Requiem and was first seen by the Hubble Space Telescope in 2016. This second lensed supernova set is called Encore and was first seen by the Webb Space Telescope in 2023. More images from these supernovas are predicted to be on the way, and exactly when they arrive should help humanity to better understand the mass distribution of the galaxy cluster, the supernovas themselves, and possibly even the universe.
https://www.flickr.com/photos/nasawebbtelescope/53412181911/in/album-72177720305127361
https://science.nasa.gov/blogs/webb/2024/10/01/webb-researchers-discover-lensed-supernova-confirm-hubble-tension/
https://science.nasa.gov/asset/webb/gravitational-lensing/
https://spaceplace.nasa.gov/supernova/en/
https://apod.nasa.gov/apod/ap251007.html
#space #galaxy #astrophotography #photography #science #physics #nature #NASA #ESA #hubble #webb #education #apod
: NASA, ESA, CSA, STScI, J. Pierel (STScI) & A. Newman (Carnegie Inst. for Science)
+ Hubble (rollover): NASA, ESA, STScI, S. A. Rodney (U. South Carolina) & G. Brammer (NBI, U. Copenhagen)
Explanation:
Now a second supernova in this same galaxy is repeating. The cause is the gravitational lens effect of a massive foreground cluster of galaxies (MACS J0138) -- it creates multiple images of a perfectly aligned background galaxy (MRG-M0138). What's particularly interesting is that this background galaxy has young stars that keep blowing up. And images of each supernova explosion keep coming to us multiple times through different paths through the cluster. The original lensed supernova set, shown in the rollover, is called Requiem and was first seen by the Hubble Space Telescope in 2016. This second lensed supernova set is called Encore and was first seen by the Webb Space Telescope in 2023. More images from these supernovas are predicted to be on the way, and exactly when they arrive should help humanity to better understand the mass distribution of the galaxy cluster, the supernovas themselves, and possibly even the universe.")
Alt...
2025 October 7
An image shows a cluster of galaxies with unusual arcs. The arcs are background galaxies distorted by the gravitational lens effect of the foreground cluster. The background galaxy shows several spots that are supernovas occurring in the galaxy.
SN Encore: A Second Supernova Seen Several Times
* Images Credit:
+ Webb (main): NASA, ESA, CSA, STScI, J. Pierel (STScI) & A. Newman (Carnegie Inst. for Science)
+ Hubble (rollover): NASA, ESA, STScI, S. A. Rodney (U. South Carolina) & G. Brammer (NBI, U. Copenhagen)
Explanation:
Now a second supernova in this same galaxy is repeating. The cause is the gravitational lens effect of a massive foreground cluster of galaxies (MACS J0138) -- it creates multiple images of a perfectly aligned background galaxy (MRG-M0138). What's particularly interesting is that this background galaxy has young stars that keep blowing up. And images of each supernova explosion keep coming to us multiple times through different paths through the cluster. The original lensed supernova set, shown in the rollover, is called Requiem and was first seen by the Hubble Space Telescope in 2016. This second lensed supernova set is called Encore and was first seen by the Webb Space Telescope in 2023. More images from these supernovas are predicted to be on the way, and exactly when they arrive should help humanity to better understand the mass distribution of the galaxy cluster, the supernovas themselves, and possibly even the universe.
 & Jerry Bonnell (UMCP)
NASA Official: Amber Straughn Specific rights apply.
NASA Web Privacy, Accessibility, Notices;
A service of: ASD at NASA / GSFC,
NASA Science Activation
& Michigan Tech. U.")
Alt...
RollOver
Image Hubble 2016
Authors & editors: Robert Nemiroff (MTU) & Jerry Bonnell (UMCP)
NASA Official: Amber Straughn Specific rights apply.
NASA Web Privacy, Accessibility, Notices;
A service of: ASD at NASA / GSFC,
NASA Science Activation
& Michigan Tech. U.
2025 October 6
The Changing Ion Tail of Comet Lemmon
* Images Credit & Copyright: Victor Sabet & Julien De Winter
https://www.instagram.com/dwj85
Explanation:
How does a comet tail change? It depends on the comet. The ion tail of Comet C/2025 A6 (Lemmon) has been changing markedly, as detailed in the featured image sequenced over six days between September 25 and October 3 (left to right) from Texas, USA. On some days, the comet's ion tail was relatively more complex than other days. Reasons for tail changes include the rate of ejection of material from the comet's nucleus, the strength and complexity of the passing solar wind, and the rotation rate of the comet. Sometimes, over the course of a week, apparent differences even result from a change of perspective from the Earth. In general, a comet's ion tail will point away from the Sun, as gas expelled is pushed out by the Sun's wind. Comet Lemmon is still inbound and brightening, passing nearest the Earth on October 21 and nearest the Sun on November 8.
https://theskylive.com/c2025a6-info
http://www2.ess.ucla.edu/~jewitt/tail.html
https://spaceplace.nasa.gov/comets/en/
https://apod.nasa.gov/apod/ap251006.html
#space #comets #astrophotography #photography #science #astronomy #nature #NASA #ESA #education
 has been changing markedly, as detailed in the featured image sequenced over six days between September 25 and October 3 (left to right) from Texas, USA. On some days, the comet's ion tail was relatively more complex than other days. Reasons for tail changes include the rate of ejection of material from the comet's nucleus, the strength and complexity of the passing solar wind, and the rotation rate of the comet. Sometimes, over the course of a week, apparent differences even result from a change of perspective from the Earth. In general, a comet's ion tail will point away from the Sun, as gas expelled is pushed out by the Sun's wind. Comet Lemmon is still inbound and brightening, passing nearest the Earth on October 21 and nearest the Sun on November 8.
Authors & editors: Robert Nemiroff (MTU) & Jerry Bonnell (UMCP)
NASA Official: Amber Straughn Specific rights apply.
NASA Web Privacy, Accessibility, Notices;
A service of: ASD at NASA / GSFC,
NASA Science Activation
& Michigan Tech. U.")
Alt...
2025 October 6
A comet with a green head at the bottom and a complex tail extending toward the top is shown, horizontally side by side, six times. Please see the explanation for more detailed information.
The Changing Ion Tail of Comet Lemmon
* Images Credit & Copyright: Victor Sabet & Julien De Winter
Explanation:
How does a comet tail change? It depends on the comet. The ion tail of Comet C/2025 A6 (Lemmon) has been changing markedly, as detailed in the featured image sequenced over six days between September 25 and October 3 (left to right) from Texas, USA. On some days, the comet's ion tail was relatively more complex than other days. Reasons for tail changes include the rate of ejection of material from the comet's nucleus, the strength and complexity of the passing solar wind, and the rotation rate of the comet. Sometimes, over the course of a week, apparent differences even result from a change of perspective from the Earth. In general, a comet's ion tail will point away from the Sun, as gas expelled is pushed out by the Sun's wind. Comet Lemmon is still inbound and brightening, passing nearest the Earth on October 21 and nearest the Sun on November 8.
Authors & editors: Robert Nemiroff (MTU) & Jerry Bonnell (UMCP)
NASA Official: Amber Straughn Specific rights apply.
NASA Web Privacy, Accessibility, Notices;
A service of: ASD at NASA / GSFC,
NASA Science Activation
& Michigan Tech. U.
From Contributors to Wikimedia projects:
[...]
Saturn's axial inclination
Saturn's axial tilt is 26.7°, meaning that widely varying views of the rings, of which the visible ones occupy its equatorial plane, are obtained from Earth at different times. Earth makes passes through the ring plane every 13 to 15 years, about every half Saturn year, and there are about equal chances of either a single or three crossings occurring in each such occasion. The most recent ring plane crossings were on 22 May 1995, 10 August 1995, 11 February 1996, 4 September 2009 and 23 March 2025; upcoming events will occur on 15 October 2038, 1 April 2039 and 9 July 2039. Favorable ring plane crossing viewing opportunities (with Saturn not close to the Sun) only come during triple crossings.
Saturn's equinoxes, when the Sun passes through the ring plane, are not evenly spaced. The sun passes south to north through the ring plane when Saturn's heliocentric longitude is 173.6 degrees (e.g. 11 August 2009), about the time Saturn crosses from Leo to Virgo. 15.7 years later Saturn's longitude reaches 353.6 degrees and the sun passes to the south side of the ring plane. On each orbit the Sun is north of the ring plane for 15.7 Earth years, then south of the plane for 13.7 years. Dates for north-to-south crossings include 19 November 1995 and 6 May 2025, with south-to-north crossings on 11 August 2009 and 23 January 2039. During the period around an equinox the illumination of most of the rings is greatly reduced, making possible unique observations highlighting features that depart from the ring plane.
[...]
More in next post.
* The ALT-Text for this image is pretty detailed, full discription of this image here:
https://commons.wikimedia.org/wiki/File:Saturn,_its_rings,_and_a_few_of_its_moons.jpg
#space #saturn #astrophotography #photography #science #astronomy #physics #nature #NASA #ESA #education

Alt...
Seen from our planet, the view of Saturn's rings during equinox is extremely foreshortened and limited. But in orbit around Saturn, Cassini has no such problems. From 20 degrees above the ring-plane, Cassini's wide angle camera shot 75 exposures in succession for this mosaic showing Saturn, its rings, and a few of its moons a day and a half after exact Saturn equinox, when the Sun's disk was exactly overhead at the planet's equator. The novel illumination geometry that accompanies equinox lowers the Sun's angle to the ring-plane, significantly darkens the rings, and causes out-of-plane structures to look anomalously bright and to cast shadows across the rings. These scenes are possible only during the few months before and after Saturn's equinox which occurs only once in about 15 Earth years. Also at equinox, the shadows of the planet's expansive rings are compressed into a single, narrow band cast onto the planet as seen in this mosaic. The images comprising the mosaic, taken over about eight hours, were extensively processed before being joined together. First, each was re-projected into the same viewing geometry and then digitally processed to make the image "joints" seamless and to remove lens flares, radially extended bright artefacts resulting from light being scattered within the camera optics ..
* URL for full image description in main text
CREDIT
NASA/JPL/Space Science Institute
From Contributors to Wikimedia projects:
[...]
The rings have numerous gaps where particle density drops sharply: two opened by known moons embedded within them, and many others at locations of known destabilizing orbital resonances with the moons of Saturn. Other gaps remain unexplained. Stabilizing resonances, on the other hand, are responsible for the longevity of several rings, such as the Titan Ringlet and the G Ring. Well beyond the main rings is the Phoebe ring, which is presumed to originate from Phoebe and thus share its retrograde orbital motion. It is aligned with the plane of Saturn's orbit. Saturn has an axial tilt of 27 degrees, so this ring is tilted at an angle of 27 degrees to the more visible rings orbiting above Saturn's equator.
[...]
More in next post.
* The ALT-Texts for the images are pretty detailed, full discription for
+ upper right image:
https://en.wikipedia.org/wiki/File:Saturn%27s_rings_in_visible_light_and_radio.jpg
#space #saturn #astrophotography #photography #science #astronomy #physics #nature #NASA #ESA #education
 taken on May 9, 2007 (distances are to the planet's center).
A scan across Saturn's incredible halo of ice rings yields a study in precision and order. This natural color mosaic was acquired by the Cassini spacecraft as it soared 39 degrees above the unilluminated side of the rings. Major named gaps are labeled at the top. The main rings themselves, along with the F ring, are labeled at the bottom, along with their inner and outer boundaries. This mosaic was constructed from narrow-angle camera images taken immediately after the wide-angle camera mosaic PIA08388. Radial features can be seen in the rings that are about ten times smaller than in the wide-angle view. This scan is rotated 180 degrees compared to PIA08388 in order to present the rings with distance from Saturn increasing left to right. The view combines 45 images -- 15 separate sets of red, green and blue images -- taken over the course of about 2.5 hours, as Cassini scanned across the rings. The images in this view were obtained on May 9, 2007, at a distance of approximately 1.1 million kilometers (700,000 miles) from Saturn. Image scale in the radial (horizontal) direction is about 6 kilometers (4 miles) per pixel.
CREDIT
NASA/JPL/Space Science Institute")
Alt...
Natural-color mosaic of Cassini narrow-angle camera images of the unilluminated side of Saturn's D, C, B, A and F rings (left to right) taken on May 9, 2007 (distances are to the planet's center).
A scan across Saturn's incredible halo of ice rings yields a study in precision and order. This natural color mosaic was acquired by the Cassini spacecraft as it soared 39 degrees above the unilluminated side of the rings. Major named gaps are labeled at the top. The main rings themselves, along with the F ring, are labeled at the bottom, along with their inner and outer boundaries. This mosaic was constructed from narrow-angle camera images taken immediately after the wide-angle camera mosaic PIA08388. Radial features can be seen in the rings that are about ten times smaller than in the wide-angle view. This scan is rotated 180 degrees compared to PIA08388 in order to present the rings with distance from Saturn increasing left to right. The view combines 45 images -- 15 separate sets of red, green and blue images -- taken over the course of about 2.5 hours, as Cassini scanned across the rings. The images in this view were obtained on May 9, 2007, at a distance of approximately 1.1 million kilometers (700,000 miles) from Saturn. Image scale in the radial (horizontal) direction is about 6 kilometers (4 miles) per pixel.
CREDIT
NASA/JPL/Space Science Institute
. An \"image\" is then constructed by assuming circular symmetry over the ring region of interest. Color is usually added to encode other information related to the observed structure. This image compares structure of Saturn's rings observed by these two approaches. The upper half is a natural color mosaic of images of the illuminated side of the rings by the Cassini narrow-angle camera (see PIA06175). The bottom simulated image is constructed from a radio occultation observation conducted on May 3, 2005. For another view created using this process, see PIA07872. Color in the lower image is used to represent information about ring particle sizes ..
* URL for full image description in main text
CREDIT
NASA/JPL/Space Science Institute")
Alt...
Cassini instruments provide complementary information about the structure of Saturn's rings. Narrow and wide angle cameras provide images in the visible region of the electromagnetic spectrum much like a digital camera does. The images have information about how the ring structure differs both with distance from the planet and with position around the equatorial circle. However, resolution is usually limited to few kilometers at best. Radio and stellar occultations of the rings also provide important information about ring structure, but only along a one-dimensional track through the rings. The radial resolution can be as fine as 50 meters (164 feet). An "image" is then constructed by assuming circular symmetry over the ring region of interest. Color is usually added to encode other information related to the observed structure. This image compares structure of Saturn's rings observed by these two approaches. The upper half is a natural color mosaic of images of the illuminated side of the rings by the Cassini narrow-angle camera (see PIA06175). The bottom simulated image is constructed from a radio occultation observation conducted on May 3, 2005. For another view created using this process, see PIA07872. Color in the lower image is used to represent information about ring particle sizes ..
* URL for full image description in main text
CREDIT
NASA/JPL/Space Science Institute
 from Saturn and at a Sun-Saturn-spacecraft, or phase, angle of 133 degrees. Image scale is 2.2 miles (3.6 kilometers) per pixel.
CREDIT
NASA/JPL/Space Science Institute")
Alt...
Not all of Saturn's rings are created equal: here the C and D rings appear side-by-side, but the C ring, which occupies the bottom half of this image, clearly outshines its neighbor. The D ring appears fainter than the C ring because it is comprised of less material. However, even rings as thin as the D ring can pose hazards to spacecraft. Given the high speeds at which Cassini travels, impacts with particles just fractions of a millimeter in size have the potential to damage key spacecraft components and instruments. Nonetheless, near the end of Cassini's mission, navigators plan to thread the spacecraft's orbit through the narrow region between the D ring and the top of Saturn's atmosphere. This view looks toward the unilluminated side of the rings from about 12 degrees below the ringplane. The image was taken in visible light with the Cassini spacecraft narrow-angle camera on Feb. 11, 2015. The view was acquired at a distance of approximately 372,000 miles (599,000 kilometers) from Saturn and at a Sun-Saturn-spacecraft, or phase, angle of 133 degrees. Image scale is 2.2 miles (3.6 kilometers) per pixel.
CREDIT
NASA/JPL/Space Science Institute
 from Saturn. The image scale is 4.6 kilometers (2.9 miles) per pixel.
CREDIT
NASA/JPL/Space Science Institute")
Alt...
This fantastic close-up of Saturn's outer C ring shows large and sharp changes in brightness across the rings, owing to the extreme variations in ring particle concentrations at different distances from the planet. The dark gap running through the center contains the Maxwell ringlet, as well as a faint, narrow ringlet discovered in Cassini images. Another very dark region to the right of the Maxwell gap is also a narrow gap. The image was taken in visible light with the Cassini spacecraft narrow angle camera on Oct. 29, 2004, at a distance of about 836,000 kilometers (519,000 miles) from Saturn. The image scale is 4.6 kilometers (2.9 miles) per pixel.
CREDIT
NASA/JPL/Space Science Institute
From Contributors to Wikimedia projects:
Rings of Saturn
Saturn has the most extensive and complex ring system of any planet in the Solar System. The rings consist of particles in orbit around the planet and are made almost entirely of water ice, with a trace component of rocky material. Particles range from micrometers to meters in size. There is no consensus as to what mechanism facilitated their formation: while investigations using theoretical models suggested they formed early in the Solar System's existence, newer data from Cassini suggests a more recent date of formation. In September 2023, astronomers reported studies suggesting that the rings of Saturn may have resulted from the collision of two moons "a few hundred million years ago,".
Though light reflected from the rings increases Saturn's apparent brightness, they are not themselves visible from Earth with the naked eye. In 1610, the year after his first observations with a telescope, Galileo Galilei became the first person to observe Saturn's rings, though he could not see them well enough to discern their true nature. In 1655, Christiaan Huygens was the first person to describe them as a disk surrounding Saturn. The concept that Saturn's rings are made up of a series of tiny ringlets can be traced to Pierre-Simon Laplace, although true gaps are few – it is more correct to think of the rings as an annular disk with concentric local maxima and minima in density and brightness.
[..]
Read more next post ..
* The ALT-Texts for the images are pretty detailed, full discription for
+ upper left image:
https://commons.wikimedia.org/wiki/File:PIA17172_Saturn_eclipse_mosaic_bright_crop.jpg
+ and the upper right image: https://commons.wikimedia.org/wiki/File:Unraveling_Saturn%27s_Rings.jpg
#space #saturn #astrophotography #photography #science #astronomy #physics #nature #NASA #ESA #education
 distant. Earth appears as a dot at 4 o'clock, between the G and E rings – with its brightness artificially exaggerated in this photograph.
CREDIT
NASA
JPL-Caltech
Space Science Institute
On July 19, 2013, in an event celebrated the world over, NASA's Cassini spacecraft slipped into Saturn's shadow and turned to image the planet, seven of its moons, its inner rings -- and, in the background, our home planet, Earth. With the sun's powerful and potentially damaging rays eclipsed by Saturn itself, Cassini's onboard cameras were able to take advantage of this unique viewing geometry. They acquired a panoramic mosaic of the Saturn system that allows scientists to see details in the rings and throughout the system as they are backlit by the sun.
With both Cassini's wide-angle and narrow-angle cameras aimed at Saturn, Cassini was able to capture 323 images in just over four hours. This final mosaic uses 141 of those wide-angle images. Images taken using the red, green and blue spectral filters of the wide-angle camera were combined and mosaicked together to create this natural-color view. This image spans about 404,880 miles (651,591 kilometers) across. The outermost ring shown here is Saturn's E ring, the core of which is situated about 149,000 miles (240,000 kilometers) from Saturn
*See URL to full discription in main text")
Alt...
The full set of rings, imaged on 19 July 2013 as Saturn eclipses the Sun from the vantage of the Cassini orbiter, 1.2 million kilometres (3⁄4 million miles) distant. Earth appears as a dot at 4 o'clock, between the G and E rings – with its brightness artificially exaggerated in this photograph.
CREDIT
NASA
JPL-Caltech
Space Science Institute
On July 19, 2013, in an event celebrated the world over, NASA's Cassini spacecraft slipped into Saturn's shadow and turned to image the planet, seven of its moons, its inner rings -- and, in the background, our home planet, Earth. With the sun's powerful and potentially damaging rays eclipsed by Saturn itself, Cassini's onboard cameras were able to take advantage of this unique viewing geometry. They acquired a panoramic mosaic of the Saturn system that allows scientists to see details in the rings and throughout the system as they are backlit by the sun.
With both Cassini's wide-angle and narrow-angle cameras aimed at Saturn, Cassini was able to capture 323 images in just over four hours. This final mosaic uses 141 of those wide-angle images. Images taken using the red, green and blue spectral filters of the wide-angle camera were combined and mosaicked together to create this natural-color view. This image spans about 404,880 miles (651,591 kilometers) across. The outermost ring shown here is Saturn's E ring, the core of which is situated about 149,000 miles (240,000 kilometers) from Saturn
*See URL to full discription in main text
 were sent from Cassini through the rings to Earth. The observed change of each signal as Cassini moved behind the rings provided a profile of the distribution of ring material as a function of distance from Saturn, or an optical depth profile. This simulated image was constructed from the measured optical depth profiles. It depicts the observed ring structure at a resolution of about 10 kilometers (6 miles). Shades of purple, primarily over most of the middle ring, the B ring, and the inner portion of the outer ring, the A ring, indicate regions where there is a lack of particles less than 5 centimeters (about 2 inches) in diameter. Green and blue shades indicate regions where there are particles of sizes smaller than 5 centimeters (2 inches) and 1 centimeter (less than one third of an inch), respectively, primarily in the outer A ring and within most of the inner ring, the C ring ...
* See URL to full discription in main text
CREDIT
NASA / JPL")
Alt...
In this simulated image of Saturn's rings, color is used to present information about ring particle sizes in different regions based on the measured attenuations of three radio signals. Specially designed Cassini orbits place Earth and Cassini on opposite sides of Saturn's rings, a geometry known as occultation. Cassini conducted the first radio occultation observation of Saturn's rings on May 3, 2005. Three simultaneous radio signals of 0.94, 3.6, and 13 centimeter wavelength (Ka-, X-, and S-bands) were sent from Cassini through the rings to Earth. The observed change of each signal as Cassini moved behind the rings provided a profile of the distribution of ring material as a function of distance from Saturn, or an optical depth profile. This simulated image was constructed from the measured optical depth profiles. It depicts the observed ring structure at a resolution of about 10 kilometers (6 miles). Shades of purple, primarily over most of the middle ring, the B ring, and the inner portion of the outer ring, the A ring, indicate regions where there is a lack of particles less than 5 centimeters (about 2 inches) in diameter. Green and blue shades indicate regions where there are particles of sizes smaller than 5 centimeters (2 inches) and 1 centimeter (less than one third of an inch), respectively, primarily in the outer A ring and within most of the inner ring, the C ring ...
* See URL to full discription in main text
CREDIT
NASA / JPL
 infrared light. In the false-color IR view, greater water ice content and larger grain size lead to blue-green color, while greater non-ice content and smaller grain size yield a reddish hue.
PIA23170: Infrared Eye Yields New Spectral Map
The false-color image at right shows spectral mapping of Saturn's A, B and C rings, captured by Cassini's Visible and Infrared Mapping Spectrometer (VIMS). It displays an infrared view of the rings, rather than an image in visible light. The blue-green areas are the regions with the purest water ice and/or largest grain size (primarily the A and B rings), while the reddish color indicates increasing amounts of non-icy material and/or smaller grain sizes (primarily in the C ring and Cassini Division). At left, the same image is overlaid on a natural-color mosaic of Saturn taken by Cassini's Imaging Science Subsystem.
CREDIT
NASA/JPL-Caltech")
Alt...
Saturn and its A, B and C rings in visible and (inset) infrared light. In the false-color IR view, greater water ice content and larger grain size lead to blue-green color, while greater non-ice content and smaller grain size yield a reddish hue.
PIA23170: Infrared Eye Yields New Spectral Map
The false-color image at right shows spectral mapping of Saturn's A, B and C rings, captured by Cassini's Visible and Infrared Mapping Spectrometer (VIMS). It displays an infrared view of the rings, rather than an image in visible light. The blue-green areas are the regions with the purest water ice and/or largest grain size (primarily the A and B rings), while the reddish color indicates increasing amounts of non-icy material and/or smaller grain sizes (primarily in the C ring and Cassini Division). At left, the same image is overlaid on a natural-color mosaic of Saturn taken by Cassini's Imaging Science Subsystem.
CREDIT
NASA/JPL-Caltech
 is round and has a variety of terrains across its surface. Meanwhile, Hyperion (to the upper-left of Tethys) is the \"wild one\" with a chaotic spin and Prometheus (lower-left) is a tiny moon that busies itself sculpting the F ring. To learn more about the surface of Tethys (660 miles, or 1,062 kilometers across), see PIA17164. More on the chaotic spin of Hyperion (168 miles, or 270 kilometers across) can be found at PIA07683. And discover more about the role of Prometheus (53 miles, or 86 kilometers across) in shaping the F ring in PIA12786. This view looks toward the sunlit side of the rings from about 1 degree above the ringplane. The image was taken in visible light with the Cassini spacecraft narrow-angle camera on July 14, 2014. The view was acquired at a distance of approximately 1.2 million miles (1.9 million kilometers) from Tethys and at a Sun-Tethys-spacecraft, or phase, angle of 22 degrees. Image scale is 7 miles (11 kilometers) per pixel.
CREDIT
NASA/JPL-Caltech")
Alt...
The Odd Trio September 22, 2014
The Cassini spacecraft captures a rare family photo of three of Saturn's moons that couldn't be more different from each other! As the largest of the three, Tethys (image center) is round and has a variety of terrains across its surface. Meanwhile, Hyperion (to the upper-left of Tethys) is the "wild one" with a chaotic spin and Prometheus (lower-left) is a tiny moon that busies itself sculpting the F ring. To learn more about the surface of Tethys (660 miles, or 1,062 kilometers across), see PIA17164. More on the chaotic spin of Hyperion (168 miles, or 270 kilometers across) can be found at PIA07683. And discover more about the role of Prometheus (53 miles, or 86 kilometers across) in shaping the F ring in PIA12786. This view looks toward the sunlit side of the rings from about 1 degree above the ringplane. The image was taken in visible light with the Cassini spacecraft narrow-angle camera on July 14, 2014. The view was acquired at a distance of approximately 1.2 million miles (1.9 million kilometers) from Tethys and at a Sun-Tethys-spacecraft, or phase, angle of 22 degrees. Image scale is 7 miles (11 kilometers) per pixel.
CREDIT
NASA/JPL-Caltech
From Contributors to Wikimedia projects:
SATURN AS SEEN BY GALILEO. Detail of the letter sent by Galileo to Belisario Vinta, written in Padova on 30.07.1610. The shape of Saturn first seen by the Pisan astronomer, squared in green. Here Galileo writes: "It is that the star of Saturn is not a single one, but an aggregate of three that almost touch each other and that never move or change with each other, they are arranged in a row along the Zodiac, the middle one being three times larger than the other two lateral ones and being situated in this way: oOo,..."
From "Galileo-Kepler. The Message and the Sidereal Messenger", Alianza Editorial. 1984. In another letter addressed to Giuliano de Medici, Galileo writes: "... I observed that the highest planet was threefold: that is, with great admiration on my part I have observed that Saturn is not a single star, but three together that almost touch. They are completely immobile with each other, arranged in this way oOo, the middle one being much larger than the lateral ones. They are situated one to the east and to the west of the other, exactly in a straight line. They are not just according to the line of the Zodiac, but the western line rises somewhat to the north; perhaps they are parallel to the equator.
If it were observed with a spectacle that was not of great magnification, three very different stars would not appear, but Saturn would appear to be an elongated star in the shape of an olive, like this [small ellipse]; but by means of a spectacle that multiplies more than a thousand times on the surface, the three globes will be seen very clear and almost touching, not appearing between them a division greater than a subtle dark thread..."
Image Credit:
Galileo Galilei - Museo Galileo Galilei, Florence. Biblioteca Nazionale Centrale, Ms. Gal. 86, f. 42r
#space #saturn #astrophotography #photography #science #astronomy #physics #nature #history #NASA #ESA #education

Alt...
SATURN AS SEEN BY GALILEO. Detail of the letter sent by Galileo to Belisario Vinta, written in Padova on 30.07.1610. The shape of Saturn first seen by the Pisan astronomer, squared in green. Here Galileo writes: "It is that the star of Saturn is not a single one, but an aggregate of three that almost touch each other and that never move or change with each other, they are arranged in a row along the Zodiac, the middle one being three times larger than the other two lateral ones and being situated in this way: oOo,..."
From "Galileo-Kepler. The Message and the Sidereal Messenger", Alianza Editorial. 1984. In another letter addressed to Giuliano de Medici, Galileo writes: "... I observed that the highest planet was threefold: that is, with great admiration on my part I have observed that Saturn is not a single star, but three together that almost touch. They are completely immobile with each other, arranged in this way oOo, the middle one being much larger than the lateral ones. They are situated one to the east and to the west of the other, exactly in a straight line. They are not just according to the line of the Zodiac, but the western line rises somewhat to the north; perhaps they are parallel to the equator.
Image Credit:
Galileo Galilei - Museo Galileo Galilei, Florence. Biblioteca Nazionale Centrale, Ms. Gal. 86, f. 42r
Follow Comet 3I/ATLAS's Journey
With NASA's Eyes on the Solar System interactive app, you can follow comet 3I/ATLAS as it travels through our solar system and see where it's headed next.
https://eyes.nasa.gov/apps/solar-system/#/c_2025_n1
#comets #astrophotography #photography #science #astronomy #nature #NASA #ESA

Alt...
Follow Comet 3I/ATLAS's Journey
With NASA's Eyes on the Solar System interactive app, you can follow comet 3I/ATLAS as it travels through our solar system and see where it's headed next.
3I/ATLAS
Animation of comet 3I/ATLAS's trajectory through our solar system.
Discovered on July 1, 2025, Comet 3I/ATLAS is the third known object from outside our solar system to be discovered passing through our celestial neighborhood. Astronomers have categorized this object as interstellar because of the hyperbolic shape of its orbital path (it does not follow a closed orbital path about the Sun.)
Comet 3I/ATLAS poses no threat to Earth, approaching no closer than about 1.8 astronomical units (about 170 million miles, or 270 million kilometers). The comet reaches its closest point to the Sun around October 30th, 2025, at a distance of about 1.4 AU (130 million miles, or 210 million kilometers) — just inside the orbit of Mars. The size and physical properties of 3I/ATLAS are being investigated by astronomers around the world, and by various robotic spacecraft. Observations as of August 2025 indicate its nucleus is not larger than 3.5 miles (5.6 kilometers) in diameter.
CREDIT
NASA/JPL
https://science.nasa.gov/solar-system/comets/3i-atlas/
#comets #astrophotography #photography #science #astronomy #nature #NASA #ESA
TOPIC> Interstellar Visitors
2025 July 7
A drawing of our Solar System shows the orbits of Jupiter and interior planets. A white line shows the trajectory of passing comet 3I/ATLAS.
Interstellar Comet 3I/ATLAS
* Image Credit: NASA, JPL-Caltech
https://www.jpl.nasa.gov/
https://www.nasa.gov/
Explanation:
It came from outer space. An object from outside our Solar System is now passing through at high speed. Classified as a comet because of its gaseous coma, 3I/ATLAS is only the third identified macroscopic object as being so alien. The comet's trajectory is shown in white on the featured map, where the orbits of Jupiter, Mars, and Earth are shown in gold, red, and blue. Currently Comet 3I/ATLAS is about the distance of Jupiter from the Sun -- but closing, with its closest approach to our Sun expected to be within the orbit of Mars in late October. Expected to pass near both Mars and Jupiter, 3I/ATLAS is not expected to pass close to the Earth. The origin of Comet 3I/ATLAS remains unknown. Although initial activity indicates a relatively normal comet, future observations about 3I/ATLAS' composition and nature will surely continue.
https://www.esa.int/Space_Safety/Planetary_Defence/ESA_tracks_rare_interstellar_comet
https://en.wikipedia.org/wiki/3I/ATLAS
https://science.nasa.gov/solar-system/comets/3i-atlas/
https://apod.nasa.gov/apod/ap191018.html
Our Solar System:
https://science.nasa.gov/solar-system/
https://science.nasa.gov/jupiter/
https://science.nasa.gov/mars/
https://apod.nasa.gov/apod/ap250707.html
#space #comets #astrophotography #photography #science #astronomy #nature #NASA #ESA
 & Jerry Bonnell (UMCP)
NASA Official: Amber Straughn Specific rights apply.
NASA Web Privacy, Accessibility, Notices;
A service of: ASD at NASA / GSFC,
NASA Science Activation
& Michigan Tech. U.")
Alt...
2025 July 7
A drawing of our Solar System shows the orbits of Jupiter and interior planets. A white line shows the trajectory of passing comet 3I/ATLAS.
Interstellar Comet 3I/ATLAS
* Image Credit: NASA, JPL-Caltech
Explanation:
It came from outer space. An object from outside our Solar System is now passing through at high speed. Classified as a comet because of its gaseous coma, 3I/ATLAS is only the third identified macroscopic object as being so alien. The comet's trajectory is shown in white on the featured map, where the orbits of Jupiter, Mars, and Earth are shown in gold, red, and blue. Currently Comet 3I/ATLAS is about the distance of Jupiter from the Sun -- but closing, with its closest approach to our Sun expected to be within the orbit of Mars in late October. Expected to pass near both Mars and Jupiter, 3I/ATLAS is not expected to pass close to the Earth. The origin of Comet 3I/ATLAS remains unknown. Although initial activity indicates a relatively normal comet, future observations about 3I/ATLAS' composition and nature will surely continue.
Authors & editors: Robert Nemiroff (MTU) & Jerry Bonnell (UMCP)
NASA Official: Amber Straughn Specific rights apply.
NASA Web Privacy, Accessibility, Notices;
A service of: ASD at NASA / GSFC,
NASA Science Activation
& Michigan Tech. U.
ESA tracks rare interstellar comet
Space Safety
03/07/2025
Astronomers have confirmed the discovery of a rare celestial visitor: a comet from beyond our Solar System.
Officially named 3I/ATLAS, this newly identified interstellar object is only the third of its kind ever observed, following the famous 1I/ʻOumuamua in 2017 and 2I/Borisov in 2019.
A visitor from beyond the void
The comet was first spotted on 1 July 2025 by the Asteroid Terrestrial-impact Last Alert System (ATLAS) telescope in Río Hurtado, Chile. Its unusual trajectory immediately raised suspicions that it originated from interstellar space. This was later confirmed by astronomers around the world, and the object was given its formal designation: 3I/ATLAS, indicating its status as the third known interstellar object.
3I/ATLAS is approximately 670 million kilometres from the Sun and will make its closest approach in late October 2025, passing just inside the orbit of Mars. It is thought to be up to 20 kilometres wide and is travelling roughly 60 km/s relative to the Sun. It poses no danger to Earth, coming no closer than 240 million kilometres – over 1.5 times the distance between Earth and the Sun.
CREDIT:
ESA
https://www.esa.int/Space_Safety/Planetary_Defence/ESA_tracks_rare_interstellar_comet
#space #comets #astrophotography #photography #science #astronomy #nature #NASA #ESA
Where did this interstellar object come from?
3I/ATLAS formed in another star system and was somehow ejected into interstellar space, which is the space between the stars. For millions or even billions of years, it has drifted until it recently arrived at our solar system. It has been approaching from the general direction of the constellation Sagittarius, which is where the central region of our galaxy, the Milky Way, is located. When discovered, 3I/ATLAS was about 410 million miles (670 million kilometers) away from the Sun, within the orbit of Jupiter.
How was it determined that 3I/ATLAS didn’t originate in our solar system?
Observations of the comet’s trajectory show that it is moving too fast to be bound by the Sun’s gravity and that it's on what is known as a hyperbolic trajectory. In other words, it does not follow a closed orbital path around the Sun. It is simply passing through our solar system and will continue its journey into interstellar space, never to be seen again.
How many interstellar objects have been discovered?
This is the third known interstellar object to have been observed. Discovered in 2017, ‘Oumuamua was the first known interstellar object; the second was 2I/Borisov, which was discovered in 2019.
How big is 3I/ATLAS, and is it an asteroid or comet?
Astronomers don’t yet know how big 3I/ATLAS is, but from observations, they can see that it’s active, which means it has an icy nucleus and coma (a bright cloud of gas and dust surrounding a comet as it approaches the Sun). This is why astronomers categorize it as a comet and not an asteroid.
How fast is it moving?
Very fast. When it was discovered, the interstellar comet was traveling about 137,000 miles per hour (221,000 kilometers per hour, or 61 kilometers per second), and its speed will increase as it approaches the Sun.
CREDIT:
ATLAS/University of Hawaii/NASA
https://science.nasa.gov/solar-system/comets/3i-atlas/
#space #comets #astrophotography #photography #science #astronomy #nature #NASA #ESA

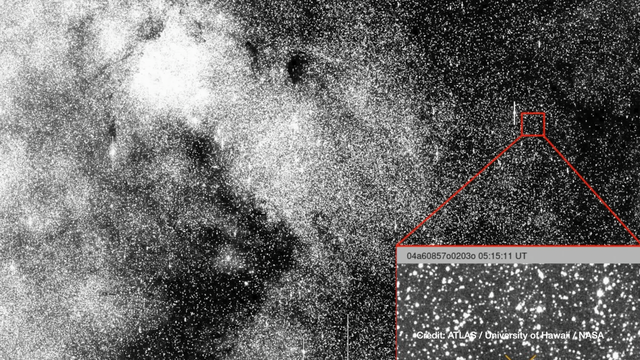
Alt...
This image shows the observation of comet 3I/ATLAS when it was discovered on July 1, 2025. The NASA-funded ATLAS survey telescope in Chile first reported that the comet originated from interstellar space.
CREDIT:
ATLAS/University of Hawaii/NASA
What We Know About Interstellar Comet 3I/ATLAS
An interstellar traveler has been discovered passing through our solar system. The NASA-funded ATLAS (Asteroid Terrestrial-impact Last Alert System) survey telescope in Rio Hurtado, Chile, first reported observations of comet 3I/ATLAS on July 1, 2025. Since the first report, additional observations from before the discovery were gathered from the archives of three ATLAS telescopes around the world and Caltech’s Zwicky Transient Facility at the Palomar Observatory in San Diego County, California. These “pre-discovery” observations extend back to June 14. The fast-moving comet, which originated outside our solar system around a different star, was discovered as a tiny speck moving across the vastness of space. When discovered it was about 410 million miles (670 million kilometers) away from the Sun, within the orbit of Jupiter.
This is the third interstellar object ever discovered, hence its name begins with the number 3 and the letter I. Scientists will have several months to observe and study the comet as it passes through our solar system and before it exits. As of July 3, 2025, the comet is just inside the orbit of Jupiter and in late October 2025 it will make its closest approach to our sun from just inside the orbit of Mars. It poses no threat to Earth but offers a fascinating and rare opportunity for scientists to study these interstellar interlopers.
https://science.nasa.gov/solar-system/comets/3i-atlas/
CREDIT:
NASA Jet Propulsion Laboratory
#space #comets #astrophotography #photography #science #astronomy #nature #NASA #ESA
Alt...
An interstellar traveler has been discovered passing through our solar system. The NASA-funded ATLAS (Asteroid Terrestrial-impact Last Alert System) survey telescope in Rio Hurtado, Chile, first reported observations of comet 3I/ATLAS on July 1, 2025. Since the first report, additional observations from before the discovery were gathered from the archives of three ATLAS telescopes around the world and Caltech’s Zwicky Transient Facility at the Palomar Observatory in San Diego County, California. These “pre-discovery” observations extend back to June 14. The fast-moving comet, which originated outside our solar system around a different star, was discovered as a tiny speck moving across the vastness of space. When discovered it was about 410 million miles (670 million kilometers) away from the Sun, within the orbit of Jupiter.
This is the third interstellar object ever discovered, hence its name begins with the number 3 and the letter I. Scientists will have several months to observe and study the comet as it passes through our solar system and before it exits. As of July 3, 2025, the comet is just inside the orbit of Jupiter and in late October 2025 it will make its closest approach to our sun from just inside the orbit of Mars. It poses no threat to Earth but offers a fascinating and rare opportunity for scientists to study these interstellar interlopers.
CREDIT:
NASA Jet Propulsion Laboratory
2017 November 22
'Oumuamua: Interstellar Asteroid
* Illustration Credit: European Southern Observatory, M. Kornmesser
http://www.eso.org/public/
Explanation:
Nothing like it has ever been seen before. The unusual space rock 'Oumuamua is so intriguing mainly because it is the first asteroid ever detected from outside our Solar System -- although likely many more are to follow given modern computer-driven sky monitoring. Therefore humanity's telescopes -- of nearly every variety -- have put 'Oumuamua into their observing schedule to help better understand this unusual interstellar visitor. Pictured is an artist's illustration of what 'Oumuamua might look like up close. 'Oumuamua is also intriguing, however, because it has unexpected parallels to Rama, a famous fictional interstellar spaceship created by the late science fiction writer Arthur C. Clarke. Like Rama, 'Oumuamua is unusually elongated, should be made of strong material to avoid breaking apart, is only passing through our Solar System, and passed unusually close to the Sun for something gravitationally unbound. Unlike a visiting spaceship, though, 'Oumuamua's trajectory, speed, color, and even probability of detection are consistent with it forming naturally around a normal star many millions of years ago, being expelled after gravitationally encountering a normal planet, and subsequently orbiting in our Galaxy alone. Even given 'Oumuamua's likely conventional origin, perhaps humanity can hold hope that one day we will have the technology to engineer 'Oumuamua -- or another Solar System interloper -- into an interstellar Rama of our own.
https://www.eso.org/public/news/eso1737/
https://www.jpl.nasa.gov/news/solar-systems-first-interstellar-visitor-dazzles-scientists/
https://en.wikipedia.org/wiki/1I/%CA%BBOumuamua
https://arxiv.org/abs/1711.04927
https://arxiv.org/abs/1710.11364
https://apod.nasa.gov/apod/ap171122.html
#space #comets #astrophotography #photography #science #astronomy #nature #NASA #ESA
![2017 November 22
'Oumuamua: Interstellar Asteroid
* Illustration Credit: European Southern Observatory, M. Kornmesser
Explanation:
Nothing like it has ever been seen before. The unusual space rock 'Oumuamua is so intriguing mainly because it is the first asteroid ever detected from outside our Solar System -- although likely many more are to follow given modern computer-driven sky monitoring. Therefore humanity's telescopes -- of nearly every variety -- have put 'Oumuamua into their observing schedule to help better understand this unusual interstellar visitor. Pictured is an artist's illustration of what 'Oumuamua might look like up close. 'Oumuamua is also intriguing, however, because it has unexpected parallels to Rama, a famous fictional interstellar spaceship created by the late science fiction writer Arthur C. Clarke. Like Rama, 'Oumuamua is unusually elongated, should be made of strong material to avoid breaking apart, is only passing through our Solar System, and passed unusually close to the Sun for something gravitationally unbound. Unlike a visiting spaceship, though, 'Oumuamua's trajectory, speed, color, and even probability of detection are consistent with it forming naturally around a normal star many millions of years ago, being expelled after gravitationally encountering a normal planet, and subsequently orbiting in our Galaxy alone. [...]
Authors & editors: Robert Nemiroff (MTU) & Jerry Bonnell (UMCP)
NASA Official: Phillip Newman Specific rights apply.](https://files.defcon.social/dcsocial-s3/media_attachments/files/114/810/893/191/487/246/original/ff8ad994766e8723.jpg "2017 November 22
'Oumuamua: Interstellar Asteroid
* Illustration Credit: European Southern Observatory, M. Kornmesser
Explanation:
Nothing like it has ever been seen before. The unusual space rock 'Oumuamua is so intriguing mainly because it is the first asteroid ever detected from outside our Solar System -- although likely many more are to follow given modern computer-driven sky monitoring. Therefore humanity's telescopes -- of nearly every variety -- have put 'Oumuamua into their observing schedule to help better understand this unusual interstellar visitor. Pictured is an artist's illustration of what 'Oumuamua might look like up close. 'Oumuamua is also intriguing, however, because it has unexpected parallels to Rama, a famous fictional interstellar spaceship created by the late science fiction writer Arthur C. Clarke. Like Rama, 'Oumuamua is unusually elongated, should be made of strong material to avoid breaking apart, is only passing through our Solar System, and passed unusually close to the Sun for something gravitationally unbound. Unlike a visiting spaceship, though, 'Oumuamua's trajectory, speed, color, and even probability of detection are consistent with it forming naturally around a normal star many millions of years ago, being expelled after gravitationally encountering a normal planet, and subsequently orbiting in our Galaxy alone. [...]
Authors & editors: Robert Nemiroff (MTU) & Jerry Bonnell (UMCP)
NASA Official: Phillip Newman Specific rights apply.")
Alt...
2017 November 22
'Oumuamua: Interstellar Asteroid
* Illustration Credit: European Southern Observatory, M. Kornmesser
Explanation:
Nothing like it has ever been seen before. The unusual space rock 'Oumuamua is so intriguing mainly because it is the first asteroid ever detected from outside our Solar System -- although likely many more are to follow given modern computer-driven sky monitoring. Therefore humanity's telescopes -- of nearly every variety -- have put 'Oumuamua into their observing schedule to help better understand this unusual interstellar visitor. Pictured is an artist's illustration of what 'Oumuamua might look like up close. 'Oumuamua is also intriguing, however, because it has unexpected parallels to Rama, a famous fictional interstellar spaceship created by the late science fiction writer Arthur C. Clarke. Like Rama, 'Oumuamua is unusually elongated, should be made of strong material to avoid breaking apart, is only passing through our Solar System, and passed unusually close to the Sun for something gravitationally unbound. Unlike a visiting spaceship, though, 'Oumuamua's trajectory, speed, color, and even probability of detection are consistent with it forming naturally around a normal star many millions of years ago, being expelled after gravitationally encountering a normal planet, and subsequently orbiting in our Galaxy alone. [...]
Authors & editors: Robert Nemiroff (MTU) & Jerry Bonnell (UMCP)
NASA Official: Phillip Newman Specific rights apply.
Nov. 20, 2017
Solar Systems First Interstellar Visitor Dazzles Scientists
Astronomers scrambled to observe an intriguing asteroid that zipped through the solar system on a steep trajectory from interstellar space-the first confirmed object from another star.
Now, new data reveal the interstellar interloper to be a rocky, cigar-shaped object with a somewhat reddish hue. The asteroid, named 'Oumuamua by its discoverers, is up to one-quarter mile (400 meters) long and highly-elongated-perhaps 10 times as long as it is wide. That aspect ratio is greater than that of any asteroid or comet observed in our solar system to date. While its elongated shape is quite surprising, and unlike asteroids seen in our solar system, it may provide new clues into how other solar systems formed.
The observations and analyses were funded in part by NASA and appear in the Nov. 20 issue of the journal Nature. They suggest this unusual object had been wandering through the Milky Way, unattached to any star system, for hundreds of millions of years before its chance encounter with our star system.
"For decades we've theorized that such interstellar objects are out there, and now - for the first time - we have direct evidence they exist," said Thomas Zurbuchen, associate administrator for NASA's Science Mission Directorate in Washington. "This history-making discovery is opening a new window to study formation of solar systems beyond our own."
Immediately after its discovery, telescopes around the world, including ESO's Very Large Telescope in Chile, were called into action to measure the object's orbit, brightness and color. Urgency for viewing from ground-based telescopes was vital to get the best data.
Combining the images from the FORS instrument on the ESO telescope using four different [...]
https://www.jpl.nasa.gov/news/solar-systems-first-interstellar-visitor-dazzles-scientists/
CREDIT
Jet Propulsion Laboratory
#space #comets #astrophotography #photography #science #astronomy #nature #NASA #ESA
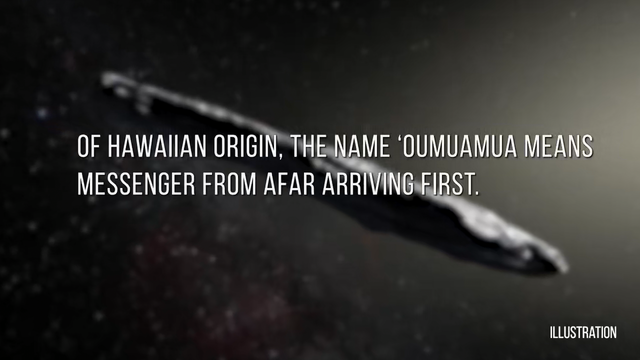
Alt...
Scientists were surprised and delighted to detect -for the first time- an interstellar asteroid passing through our solar system. Additional observations brought more surprises: the object is cigar-shaped with a somewhat reddish hue. The asteroid, named ‘Oumuamua by its discoverers, is up to one-quarter mile (400 meters) long and highly-elongated—perhaps 10 times as long as it is wide. That is unlike any asteroid or comet observed in our solar system to date, and may provide new clues into how other solar systems formed.
CREDIT
Jet Propulsion Laboratory
June 30, 2017
NASA Planetary Defense:
Backyard Asteroid Observer
Backyard astronomer Robert Holmes of Westfield, Illinois, is part of NASA's army of observers scanning the night sky for asteroids.
"We do follow-up observations with NASA's near-Earth observations program. All night long, I'm running big telescopes. One's a 24-inch, a 30-inch, and a 32-inch. And then the 50 inch is my… my biggest telescope [...]."
"[...] We do follow-up observations for the discoveries that are made by the large sky surveys. By looking at these asteroids, and measuring these asteroids, we can determine what their possibilities of actually hitting the Earth in the future are going to be.
NASA provides coordinates of specific objects that they need observations on. I'm gonna punch in the coordinates here, and I'm doing this remotely from inside a control room, not at the telescope. And so, we look these objects up and then use those coordinates to look at a tiny piece of the sky that this object happens to be in. And then we follow those objects, and define and refine orbits for those objects, and reduce the uncertainty of where it's going to go in the near future.
I started off as a volunteer in 2006. It's just blossomed into a full-time opportunity to work for NASA under their grant program, where I'm now doing this every single clear night.
Now we're starting the observing run for 2017 KK3. You don't build a telescope that's this big without having… being passionate about what you do. I'm really driven to be a part of a program that's important and has importance to the future. And we're not talking about next year or the year after, We're talking about asteroids that could potentially hit the Earth 100 years from now. And the work we do today may make a difference 100 years from now."
https://www.jpl.nasa.gov/videos/nasa-planetary-defense-backyard-asteroid-observer/
FYI:
https://science.nasa.gov/planetary-defense/
CREDIT
Jet Propulsion Laboratory
#space #comets #astrophotography #photography #science #astronomy #nature #NASA #ESA #security #tech
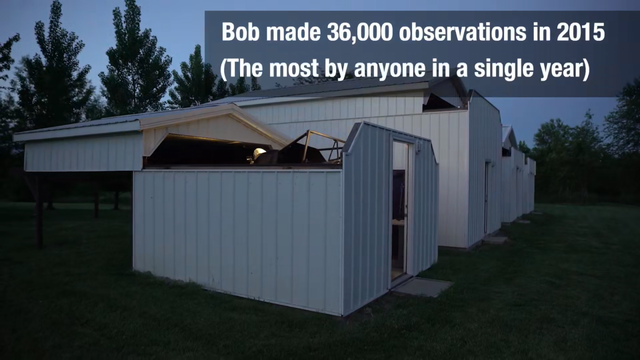
Alt...
Backyard astronomer Robert Holmes of Westfield, Illinois, is part of NASA's army of observers scanning the night sky for asteroids. By observing and tracking asteroids, NASA programs can determine whether an asteroid is potentially hazardous to Earth -- now or years in the future. In 2015, Bob made 36,000 asteroid observations -- the most by anyone in a single year. He started off as a volunteer in 2006, and his hobby has since blossomed into a full-time opportunity to work for NASA under a grant program. Find out more about how NASA finds and studies asteroids by visiting
Four Years Of Nasa Neowise Data
NASA's Near-Earth Object Wide-field Infrared Survey Explorer (NEOWISE) mission has released its fourth year of survey data. Since the mission was restarted in December 2013, after a period of hibernation, the asteroid- and comet-hunter has completely scanned the skies nearly eight times and has observed and characterized 29,375 objects in four years of operations. This total includes 788 near-Earth objects and 136 comets since the mission restart.
Near-Earth objects (NEOs) are comets and asteroids that have been nudged by the gravitational attraction of the planets in our solar system into orbits that allow them to enter Earth's neighborhood. Ten of the objects discovered by NEOWISE in the past year have been classified as potentially hazardous asteroids (PHAs). Near-Earth objects are classified as PHAs, based on their size and how closely they can approach Earth's orbit.
"NEOWISE continues to expand our catalog and knowledge of these elusive and important objects," said Amy Mainzer, NEOWISE principal investigator from NASA's Jet Propulsion Laboratory in Pasadena, California. "In total, NEOWISE has now characterized sizes and reflectivities of over 1,300 near-Earth objects since the spacecraft was launched, offering an invaluable resource for understanding the physical properties of this population, and studying what they are made of and where they have come from."
[...]
More than 2.5 million infrared images of the sky were collected in the fourth year of operations by NEOWISE. These data are combined with the year one through three NEOWISE data into a single publicly available archive. That archive contains approximately 10.3 million sets of images and a database of more than 76 billion source detections extracted from those images.
https://www.jpl.nasa.gov/news/four-years-of-nasa-neowise-data/
CREDIT
Jet Propulsion Laboratory
#space #comets #astrophotography #photography #science #astronomy #nature #NASA #ESA
From Contributors to Wikimedia projects
1I/ʻOumuamua
is the first confirmed interstellar object detected passing through the Solar System. Formally designated 1I/2017 U1, it was discovered by Robert Weryk using the Pan-STARRS telescope at Haleakalā Observatory, Hawaii, on 19 October 2017, approximately 40 days after it passed its closest point to the Sun on 9 September. When it was first observed, it was about 33 million km (21 million mi; 0.22 AU) from Earth (about 85 times as far away as the Moon) and already heading away from the Sun.
ʻOumuamua is a small object estimated to be between 100 and 1,000 metres (328 and 3,280 ft) long, with its width and thickness both estimated between 35 and 167 metres (115 and 548 ft). It has a red color, like objects in the outer Solar System. Despite its close approach to the Sun, it showed no signs of having a coma, the usual nebula around comets formed when they pass near the Sun. Further, it exhibited non‑gravitational acceleration, potentially due to outgassing or a push from solar radiation pressure.
It has a rotation rate similar to the Solar System's asteroids, but many valid models permit it to be unusually more elongated than all but a few other natural bodies observed in the solar system. This feature raised speculation about its origin. Its light curve, assuming little systematic error, presents its motion as "tumbling" rather than "spinning", and moving sufficiently fast relative to the Sun that it is likely of extrasolar origin. Extrapolated and without further deceleration, its path cannot be captured into a solar orbit, so it will eventually leave the Solar System and continue into interstellar space. Its planetary system of origin and age are unknown. [...]
https://en.wikipedia.org/wiki/1I/%CA%BBOumuamua
Image Credit:
By Tomruen https://commons.wikimedia.org/w/index.php?curid=64846159
#space #comets #astrophotography #photography #science #astronomy #nature #NASA #ESA

Alt...
Path of the hyperbolic, extrasolar object ʻOumuamua, the first confirmed interstellar object, discovered in 2017
By Tomruen - Own work made with , labels added with MSPaint, trajectory data from JPL Horizons, CC BY-SA 4.0
From Wikipedia, the free encyclopedia
2I/Borisov
2I/Borisov, originally designated C/2019 Q4 (Borisov), is the first observed rogue comet and the second observed interstellar interloper after ʻOumuamua. It was discovered by the Crimean amateur astronomer and telescope maker Gennadiy Borisov on 29 August 2019 UTC (30 August local time).
2I/Borisov has a heliocentric orbital eccentricity of 3.36 and is not bound to the Sun. The comet passed through the ecliptic of the Solar System at the end of October 2019, and made its closest approach to the Sun at just over 2 AU on 8 December 2019. The comet passed closest to Earth on 28 December 2019.
In November 2019, astronomers from Yale University said that the comet's tail was 14 times the size of Earth, and stated, "It's humbling to realize how small Earth is next to this visitor from another solar system."
The comet is formally called "2I/Borisov" by the International Astronomical Union (IAU), with "2I" or "2I/2019 Q4" being its designation and "Borisov" being its name, but is sometimes referred to as "Comet Borisov", especially in the popular press. As the second observed interstellar interloper after 1I/ʻOumuamua, it was given the "2I" designation, where "I" stands for interstellar. The name Borisov follows the tradition of naming comets after their discoverers. Before final designation as 2I/Borisov, the object was referred to by other names:
gb00234
C/2019 Q4
https://en.wikipedia.org/wiki/2I/Borisov#Nomenclature
#space #comets #astrophotography #photography #science #astronomy #nature #NASA #ESA
. The comet is falling toward the Sun and will make its closest approach on December 7, 2019, when it will be twice as far from the Sun as Earth. The comet is following a hyperbolic path around the Sun and will exit back into interstellar space. Comet 2I/Borisov is only the second such interstellar object known to have passed through the solar system. In 2017, the first identified interstellar visitor, an object formally named 'Oumuamua, swung within 24 million miles of the Sun before racing out of the solar system.
Color Info
These images are a composite of separate exposures acquired by the WFC3 instrument on the Hubble Space Telescope. The color results
Credit
NASA, ESA, and D. Jewitt (UCLA)")
Alt...
English: About This Image
HUBBLE'S VIEW OF INTERSTELLAR COMET 2I/BORISOV
https://hubblesite.org/contents/media/images/2019/53/4578-Image
NASA's Hubble Space Telescope has given astronomers their best look yet at an interstellar visitor – comet 2I/Borisov – whose speed and trajectory indicate it has come from beyond our solar system. Hubble photographed the comet at a distance of 260 million miles from Earth. This Hubble image, taken on October 12, 2019, is the sharpest view to date of the comet. Hubble reveals a central concentration of dust around the nucleus (which is too small to be seen by Hubble). The comet is falling toward the Sun and will make its closest approach on December 7, 2019, when it will be twice as far from the Sun as Earth. The comet is following a hyperbolic path around the Sun and will exit back into interstellar space. Comet 2I/Borisov is only the second such interstellar object known to have passed through the solar system. In 2017, the first identified interstellar visitor, an object formally named 'Oumuamua, swung within 24 million miles of the Sun before racing out of the solar system.
Color Info
These images are a composite of separate exposures acquired by the WFC3 instrument on the Hubble Space Telescope. The color results
Credit
NASA, ESA, and D. Jewitt (UCLA)

Alt...
2I/Borisov
The object was discovered on 30 August 2019 at MARGO, Nauchnyy, Crimea by Gennadiy Borisov using his custom-built 0.65-meter telescope. On 13 September 2019, the Gran Telescopio Canarias obtained a low-resolution visible spectrum of 2I/Borisov that revealed that this object has a surface composition not too different from that found in typical Oort Cloud comets. The IAU Working Group for Small Body Nomenclature kept the name Borisov, giving the comet the interstellar designation of 2I/Borisov. On 12 March 2020, astronomers reported observational evidence of "ongoing nucleus fragmentation" from Borisov.
In this observation, the NASA/ESA Hubble Space Telescope revisited the comet shortly after its closest approach to the Sun. There it was subjected to a greater degree of heating than it had ever experienced, after spending most of its life in the extreme cold of interstellar space. The comet is 298 million kilometres from Earth in this photo, near the inner edge of the asteroid belt. The nucleus, an agglomeration of ices and dust, is still too small to be resolved. The bright central portion is a coma made up of dust leaving the surface. The comet will make its closest approach to Earth in late December, when it will be at a distance of 290 million kilometres. Comet 2I/Borisov is only the second interstellar object known to have passed through our Solar System.
As seen from Earth, the comet was in the northern sky from September until mid-November. It crossed the ecliptic plane on 26 October near the star Regulus, and the celestial equator on 13 November 2019, entering the southern sky. On 8 December 2019, the comet reached perihelion (closest approach to the Sun) and was near the inner edge of the asteroid belt. In late December, it made its closest approach to Earth, 1.9 au, and had a solar elongation of about 80°. Due to its 44° orbital inclination, 2I/Borisov did not make any notable close approaches to the planets. 2I/Borisov entered the Solar System from the direction of Cassiopeia near the border with Perseus. This direction indicates that it originates from the galactic plane, rather than from the galactic halo. It will leave the Solar System in the direction of Telescopium. In interstellar #space, 2I/Borisov takes roughly 9000 years to travel a light-year relative to the Sun
2I/Borisov's trajectory is extremely hyperbolic, having an orbital eccentricity of 3.36. This is much higher than the 300+ known weakly hyperbolic comets, with heliocentric eccentricities just over 1, and even ʻOumuamua with an eccentricity of 1.2.
2I/Borisov also has a hyperbolic excess velocity ( v ∞ {\displaystyle v_{\infty }}) of 32 km/s, much higher than what could be explained by perturbations, which could produce velocities when approaching an infinite distance from the Sun of less than a few km/s. These two parameters are important indicators of 2I/Borisov's interstellar origin. For comparison, the Voyager 1 spacecraft, which is leaving the Solar System, is traveling at 16.9 km/s (3.57 AU/a). 2I/Borisov has a much larger eccentricity than ʻOumuamua due to its higher excess velocity and its significantly higher perihelion distance. At this larger distance, the Sun's gravity is less able to alter its path as it passes through the Solar System.
From Wikipedia
#comets #astrophotography #photography #science #astronomy #nature #NASA #ESA
TOPIC> Interstellar Visitors !>NEWS
2025 July 17
3I/ATLAS
* Image Credit: Gemini Observatory/NOIRLab/NSF/AURA/K. Meech (IfA/U. Hawaii)
* Processing: Jen Miller, Mahdi Zamani (NSF/NOIRLab)
https://noirlab.edu/public/
Explanation:
Discovered on July 1 with the NASA-funded ATLAS (Asteroid Terrestrial-impact Last Alert, System) survey telescope in Rio Hurtado, Chile, 3I/ATLAS is so designated as the third known interstellar object to pass through our Solar System It follows 1I/ʻOumuamua in 2017 and the comet 2I/Borisov in 2019. Also known as C/2025 N1, 3I/ATLAS is clearly a comet, its diffuse cometary coma, a cloud of gas and dust surrounding an icy nucleus, is easily seen in these images from the large Gemini North telescope on Maunakea, Hawai‘i. The left panel tracks the comet as it moves across the sky against fixed background stars in successive exposures. Three different filters were used, shown in red, green, and blue. In the right panel the multiple exposures are registered and combined to form a single image of the comet. The comet's interstellar origin is also clear from its orbit, determined to be an eccentric, highly hyperbolic orbit that does not loop back around the Sun and will return 3I/ATLAS to interstellar space. Not a threat to planet Earth, the inbound interstellar interloper is now within the Jupiter's orbital distance of the Sun, while its closest approach to the Sun will bring it just within the orbital distance of Mars.
https://noirlab.edu/public/news/noirlab2522/
https://minorplanetcenter.net/mpec/K25/K25N12.html
https://science.nasa.gov/blogs/planetary-defense/2025/07/02/nasa-discovers-interstellar-comet-moving-through-solar-system/
https://apod.nasa.gov/apod/ap250707.html
https://en.wikipedia.org/wiki/3I/ATLAS
https://apod.nasa.gov/apod/ap250717.html
#comets #astrophotography #photography #science #astronomy #nature #NASA #ESA #news

* Processing: Jen Miller, Mahdi Zamani (NSF/NOIRLab)
Explanation:
Discovered on July 1 with the NASA-funded ATLAS (Asteroid Terrestrial-impact Last Alert, System) survey telescope in Rio Hurtado, Chile, 3I/ATLAS is so designated as the third known interstellar object to pass through our Solar System It follows 1I/ʻOumuamua in 2017 and the comet 2I/Borisov in 2019. Also known as C/2025 N1, 3I/ATLAS is clearly a comet, its diffuse cometary coma, a cloud of gas and dust surrounding an icy nucleus, is easily seen in these images from the large Gemini North telescope on Maunakea, Hawai‘i. The left panel tracks the comet as it moves across the sky against fixed background stars in successive exposures. Three different filters were used, shown in red, green, and blue. In the right panel the multiple exposures are registered and combined to form a single image of the comet. The comet's interstellar origin is also clear from its orbit, determined to be an eccentric, highly hyperbolic orbit that does not loop back around the Sun and will return 3I/ATLAS to interstellar space. Not a threat to planet Earth, the inbound interstellar interloper is now within the Jupiter's orbital distance of the Sun, while its closest approach to the Sun will bring it just within the orbital distance of Mars.
Authors & editors: Robert Nemiroff (MTU) & Jerry Bonnell (UMCP)
NASA Official: Amber Straughn")
Alt...
2025 July 17
3I/ATLAS
* Image Credit: Gemini Observatory/NOIRLab/NSF/AURA/K. Meech (IfA/U. Hawaii)
* Processing: Jen Miller, Mahdi Zamani (NSF/NOIRLab)
Explanation:
Discovered on July 1 with the NASA-funded ATLAS (Asteroid Terrestrial-impact Last Alert, System) survey telescope in Rio Hurtado, Chile, 3I/ATLAS is so designated as the third known interstellar object to pass through our Solar System It follows 1I/ʻOumuamua in 2017 and the comet 2I/Borisov in 2019. Also known as C/2025 N1, 3I/ATLAS is clearly a comet, its diffuse cometary coma, a cloud of gas and dust surrounding an icy nucleus, is easily seen in these images from the large Gemini North telescope on Maunakea, Hawai‘i. The left panel tracks the comet as it moves across the sky against fixed background stars in successive exposures. Three different filters were used, shown in red, green, and blue. In the right panel the multiple exposures are registered and combined to form a single image of the comet. The comet's interstellar origin is also clear from its orbit, determined to be an eccentric, highly hyperbolic orbit that does not loop back around the Sun and will return 3I/ATLAS to interstellar space. Not a threat to planet Earth, the inbound interstellar interloper is now within the Jupiter's orbital distance of the Sun, while its closest approach to the Sun will bring it just within the orbital distance of Mars.
Authors & editors: Robert Nemiroff (MTU) & Jerry Bonnell (UMCP)
NASA Official: Amber Straughn
Planetary Defense at NASA
In 2016, NASA established the Planetary Defense Coordination Office (PDCO) to manage the agency's ongoing mission of finding, tracking, and better understanding asteroids and comets that could pose an impact hazard to Earth. Here you can stay informed about the PDCO, NASA's Near-Earth Object (NEO) Observations Program, and upcoming planetary defense flight missions, including NASA'S NEO Surveyor mission.
Planetary Defenders
NASA’s Planetary Defenders is a gripping documentary that delves into the high-stakes world of asteroid detection and planetary defense by journeying alongside NASA’s dedicated team of scientists, astronomers, and engineers who discover, track, and monitor near-Earth asteroids to safeguard Earth from potential impacts. Available now on NASA+ and other streaming platforms.
How would humanity respond if we discovered an asteroid headed for Earth? NASA’s "Planetary Defenders" is a gripping documentary that delves into the high-stakes world of asteroid detection and planetary defense.
#comets #astrophotography #photography #science #astronomy #tech #security #defense #NASA #ESA
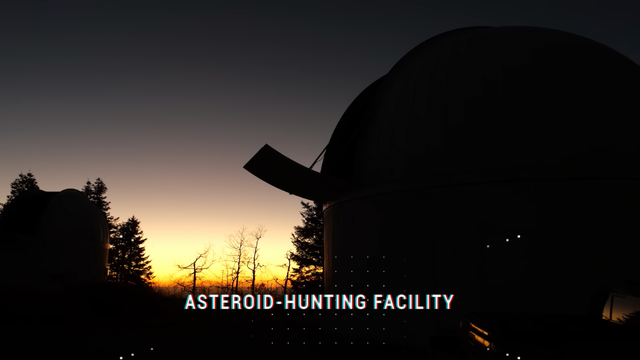
Alt...
Planetary Defenders
NASA’s Planetary Defenders is a gripping documentary that delves into the high-stakes world of asteroid detection and planetary defense by journeying alongside NASA’s dedicated team of scientists, astronomers, and engineers who discover, track, and monitor near-Earth asteroids to safeguard Earth from potential impacts. Available now on NASA+ and other streaming platforms.
How would humanity respond if we discovered an asteroid headed for Earth? NASA’s "Planetary Defenders" is a gripping documentary that delves into the high-stakes world of asteroid detection and planetary defense.
Journey alongside a dedicated team of astronomers and scientists working tirelessly to track and monitor near-Earth asteroids, aiming to protect our planet from potential impacts. This documentary captures the intricate and collaborative efforts of these unsung heroes, blending cutting-edge science with personal stories to reveal the human spirit behind this critical global endeavor. Witness the drama, the challenges and the triumphs of those on the front lines of planetary defense.
Directors: Scott Bednar, Jessie Wilde
Executive Producers: Emily Furfaro, Josh Handal
Producers: Scott Bednar, Caleb Stern, Jessie Wilde
Editor: Jessie Wilde
Motion Graphics Editor: Matt Schara
Credit: NASA
Near-Earth Asteroids as of July 2025
The headshot image of NASA Science Editorial Team
Jul 02, 2025
Each month, NASA’s Planetary Defense Coordination Office releases a monthly update featuring the most recent figures on NASA’s planetary defense efforts, near-Earth object close approaches, and other timely facts about comets and asteroids that could pose an impact hazard with Earth. Here is what we've found so far:
38,612: Total number of discovered near-Earth asteroids of all sizes.
872: Discovered asteroids larger than 1 kilometer, with an estimated 50 left to be found.
11,324: Discovered asteroids larger than 140 meters, with an estimated 14,000 remaining to be found.
100 Tons amount of dust and sand-sized particles that bombard Earth daily.
Near-Earth asteroid close approaches:
7 passed closer to Earth than the Moon in the last 30 days. 164 passed closer in the last 365 days. 493,300,000: Observations of near-Earth objects submitted to the Minor Planet Center.
Updated: July 2, 2025
https://science.nasa.gov/science-research/planetary-science/planetary-defense/near-earth-asteroids/
CREDIT
NASA Science Editorial Team
#comets #astrophotography #photography #science #astronomy #tech #security #defense #NASA #ESA

Alt...
The graphic presents data on near-Earth asteroids as of June 30, 2025. Key statistics include: 38,612: Total number of discovered near-Earth asteroids of all sizes. 872: Discovered asteroids larger than 1 kilometer, with an estimated 50 left to be found. 11,324: Discovered asteroids larger than 140 meters, with an estimated 14,000 remaining to be found. NASA-DLR BECCAL Photo Op at the Space Symposium. 100 Tons amount of dust and sand-sized particles that bombard Earth daily. Near-Earth asteroid close approaches: 7 passed closer to Earth than the Moon in the last 30 days. 164 passed closer in the last 365 days. 493,300,000: Observations of near-Earth objects submitted to the Minor Planet Center. The background shows a space-themed image with the NASA logo at the top right. 125%
Each month, NASA’s Planetary Defense Coordination Office releases a monthly update featuring the most recent figures on NASA’s planetary defense efforts, near-Earth object close approaches, and other timely facts about comets and asteroids that could pose an impact hazard with Earth. Here is what we've found so far.
Updated: July 2, 2025
June 5, 2025
by Molly Wasser
NASA’s Webb Observations Update Asteroid 2024 YR4’s Lunar Impact Odds
While asteroid 2024 YR4 is currently too distant to detect with telescopes from Earth, NASA’s James Webb Space Telescope collected one more observation of the asteroid before it escaped from view in its orbit around the Sun.
With the additional data, experts from NASA’s Center for Near-Earth Object Studies at the agency’s Jet Propulsion Laboratory in Southern California further refined the asteroid’s orbit. The Webb data improved our knowledge of where the asteroid will be on Dec. 22, 2032, by nearly 20%. As a result, the asteroid’s probability of impacting the Moon has slightly increased from 3.8% to 4.3%. In the small chance that the asteroid were to impact, it would not alter the Moon’s orbit.
When asteroid 2024 YR4 was first discovered, the asteroid had a small chance of impacting Earth. After more observations, NASA concluded the object poses no significant impact risk to Earth in 2032 and beyond.
As data comes in, it is normal for the impact probability to evolve. An international team led by Dr. Andy Rivkin from the Johns Hopkins Applied Physics Laboratory in Laurel, Maryland, made the observations using Webb’s Near-Infrared Camera in May.
Asteroid 2024 YR4 is now too far away to observe with either space or ground-based telescopes. NASA expects to make further observations when the asteroid’s orbit around the Sun brings it back into the vicinity of Earth in 2028.
CREDIT
NASA/JPL Center for Near-Earth Object Studies
#comets #astrophotography #photography #science #astronomy #tech #security #defense #NASA #ESA

Alt...
The range of possible locations – represented by yellow points – of 2024 YR4 on Dec. 22, 2032. The range decreases from April to June as we gained more data and improved our certainty of the asteroid’s position. Earth is close to the center of the white circle, which represents the Moon’s orbital path.
CREDIT
NASA/JPL Center for Near-Earth Object Studies
From Wikipedia, the free encyclopedia
3I/ATLAS,
also known as C/2025 N1 (ATLAS) and previously as A11pl3Z, is an interstellar comet discovered while inbound by the Asteroid Terrestrial-impact Last Alert System (ATLAS) station at Río Hurtado, Chile, on 1 July 2025 when it was 4.5 AU (670 million km; 420 million mi) from the Sun and moving at a relative speed of 61 km/s (38 mi/s). It follows an unbound, hyperbolic trajectory around the Sun with an orbital eccentricity of 6.145±0.006. It is the third interstellar object confirmed passing through the Solar System, after 1I/ʻOumuamua (discovered 19 October 2017) and 2I/Borisov (discovered 29 August 2019).
The size of 3I/ATLAS's nucleus is uncertain because it is an active comet surrounded by a shell of reflective dust. Estimates for the nucleus diameter of 3I/ATLAS range from 0.8 to 24 km (0.5 to 14.9 mi), though a diameter toward the lower end of the range is more likely. 3I/ATLAS will come to perihelion on 29 October 2025, at a distance of 1.358 ± 0.001 AU (203.15 ± 0.15 million km; 126.234 ± 0.093 million mi) from the Sun. When far away from the Sun, the comet's hyperbolic excess velocity ({\displaystyle v_{\infty }}) will be 58 km/s (36 mi/s) with respect to the Sun. The comet's velocity suggests it originated in the thick galactic disk which contains many older stars, and therefore the comet may be water-rich and could be more than 7 billion years old.
3I/ATLAS was discovered on 1 July 2025[f] by the NASA-funded ATLAS survey telescope at Río Hurtado, Chile (observatory code W68). At apparent magnitude 18, the newly discovered object was entering the inner Solar System at a speed of 61 km/s (140,000 mph; 220,000 km/h) relative to the Sun, located 3.50 AU (524 million km; 325 million mi) from Earth and 4.51 AU from the Sun, and was moving in the sky along the border of the constellations Serpens Cauda and Sagittarius, near the galactic plane.
#comets #astrophotography #photography #science #astronomy #NASA #ESA
Alt...
Discovery image from the Asteroid Terrestrial-impact Last Alert System
This animation shows the observations of comet 3I/ATLAS when it was discovered on July 1, 2025. The NASA-funded ATLAS survey telescope in Chile first reported that the comet originated from interstellar space.
CREDIT
ATLAS/University of Hawaii/NASA
Discovery
Discovery site ATLAS–CHL (W68)
Discovery date 1 July 2025
Designations
MPC designation
C/2025 N1
Alternative designations
A11pl3Z
Orbital characteristics
Epoch 7 July 2025 (JD 2460863.5)
Observation arc 55 days (534 obs)
Earliest precovery date 22 May 2025
Orbit type Hyperbolic (interstellar)
Perihelion 1.357±0.0008 AU
Semi-major axis −0.2638±0.0002 AU
Eccentricity 6.145±0.006[a]
Max. orbital speed 68.3 km/s @ perihelion
{\displaystyle v_{\infty }} = 58 km/s
Inclination 175.11±0.0004°
(retrograde and inclined 5°)
Longitude of
ascending node
322.16±0.008°
Argument of
periapsis 128.00±0.007°
Next perihelion 29 October 2025 11:33 ± 00:17 UT[6]
Earth MOID 0.366 AU
Mars MOID 0.018 AU
Jupiter MOID 0.246 AU
Physical characteristics
Mean diameter
~4–5 km (2.5–3.1 mi)
<23.6 km (14.7 mi)
Absolute
magnitude (H) ≈12
Comet total
magnitude (M1) 8.8±0.7
. The left panel captures the comet’s colorful trail as it moves through the Solar System. The image was composed of exposures taken through three filters, shown here as red, green, and blue. This image was made from observations on 3 July 2025
CREDIT
International Gemini Observatory/NOIRLab/NSF/AURA/K. Meech (IfA/U. Hawaii) Image Processing: Jen Miller & Mahdi Zamani (NSF NOIRLab)")
Alt...
Movement across a field of stars, as seen by Gemini North. The colorful appearance of the comet's trail is due to the telescope changing light filters while observing the comet.
Comet 3I/ATLAS streaks across a dense star field in this image captured by the Gemini North telescope's Gemini Multi-Object Spectrograph (GMOS-N). The left panel captures the comet’s colorful trail as it moves through the Solar System. The image was composed of exposures taken through three filters, shown here as red, green, and blue. This image was made from observations on 3 July 2025
CREDIT
International Gemini Observatory/NOIRLab/NSF/AURA/K. Meech (IfA/U. Hawaii) Image Processing: Jen Miller & Mahdi Zamani (NSF NOIRLab)
 reveals the comet’s compact coma — a cloud of gas and dust surrounding its icy nucleus. This image was made from observations on 3 July 2025
International Gemini Observatory/NOIRLab/NSF/AURA/K. Meech (IfA/U. Hawaii) Image Processing: Jen Miller & Mahdi Zamani (NSF NOIRLab)")
Alt...
Visible and near-infrared color composite photo by the Gemini North telescope
Comet 3I/ATLAS is captured in this image by the Gemini North telescope. The incredible sensitivity of Gemini North's Multi-Object Spectrograph (GMOS-N) reveals the comet’s compact coma — a cloud of gas and dust surrounding its icy nucleus. This image was made from observations on 3 July 2025
International Gemini Observatory/NOIRLab/NSF/AURA/K. Meech (IfA/U. Hawaii) Image Processing: Jen Miller & Mahdi Zamani (NSF NOIRLab)
Alt...
Interstellar comet 3I/ATLAS (formerly A11pl3Z) moving across a field of stars, as seen by the 8.2-meter Very Large Telescope (UT1) at Cerro Paranal. Images were taken with the FORS2 camera on the night of 2025 July 4, from 06:50 to 07:01 UTC. The comet is the bright, white moving fuzzy object near the center of the image. Images are immediately public domain and were taken from observing program 115.29F2.001, titled "A11pl3Z, the 3rd interstellar object"
Olivier Hainaut et al./European Southern Observatory (processed by Nrco0e) - Raw images downloaded from ESO Science Archive
Alt...
Animation of 3I/ATLAS, moving through the inner Solar System
Hyperbolic trajectory of 3I/ATLAS (blue) through the Solar System, with orbits of planets shown
CREDIT
CSS, D. Rankin; Video recorded and edited by User:Renerpho
Alt...
At the Deep Random Survey in Chile
This is a gif animation of interstellar comet 3I/ATLAS (formerly A11pl3Z) moving across a field of trailed stars. Each frame is a 600-second exposure where the telescope is actively following the object, so the stars appear trailed while the object appears pointlike. North is up, East is left. These images were taken by the Deep Random Survey's 0.43-meter telescope in Chile. Images from 2025 July 2, 00:42-01:23 UT The sporadic single white pixels across the image are hot (defective) pixels in the camera.
CREDIT
Nrco0e, aka K Ly at Deep Random Survey
2025 August 9
Interstellar Interloper 3I/ATLAS from Hubble
* Image Credit: NASA, ESA, David Jewitt (UCLA) et al. -
https://www.nasa.gov/
https://www.spacetelescope.org/
http://www2.ess.ucla.edu/~jewitt/David_Jewitt.html
https://epss.ucla.edu/
* Processing; Joseph DePasquale (STScI)
https://www.stsci.edu/who-we-are
Explanation:
Discovered on July 1 with the NASA-funded ATLAS (Asteroid Terrestrial-impact Last Alert System) survey telescope in Rio Hurtado, Chile, 3I/ATLAS is so designated as the third known interstellar object to pass through our Solar System. It follows 1I/ʻOumuamua in 2017 and the comet 2I/Borisov in 2019. Also known as C/2025 N1, 3I/ATLAS is a comet. A teardrop-shaped cloud of dust, ejected from its icy nucleus warmed by increasing sunlight, is seen in this sharp image from the Hubble Space Telescope captured on July 21. Background stars are streaked in the exposure as Hubble tracked the fastest comet ever recorded on its journey toward the inner solar system. An analysis of the Hubble image indicates the solid nucleus, hidden from direct view, is likely less that 5.6 kilometers in diameter. This comet's interstellar origin is clear from its orbit, determined to be an eccentric, highly hyperbolic orbit that does not loop back around the Sun and will return 3I/ATLAS to interstellar space. Not a threat to planet Earth, the inbound interstellar interloper is now within the Jupiter's orbital distance of the Sun, while its closest approach to the Sun will bring it just inside the orbital distance of Mars.
https://science.nasa.gov/asset/hubble/comet-3i-atlas/
https://en.wikipedia.org/wiki/3I/ATLAS
https://arxiv.org/abs/2508.02934
https://science.nasa.gov/missions/hubble/as-nasa-missions-study-interstellar-comet-hubble-makes-size-estimate/
https://minorplanetcenter.net/mpec/K25/K25N12.html
https://apod.nasa.gov/apod/ap250809.html
#comets #astrophotography #photography #science #astronomy #nature #NASA #ESA
 et al. -
* Processing; Joseph DePasquale (STScI)
Explanation:
Discovered on July 1 with the NASA-funded ATLAS (Asteroid Terrestrial-impact Last Alert System) survey telescope in Rio Hurtado, Chile, 3I/ATLAS is so designated as the third known interstellar object to pass through our Solar System. It follows 1I/ʻOumuamua in 2017 and the comet 2I/Borisov in 2019. Also known as C/2025 N1, 3I/ATLAS is a comet. A teardrop-shaped cloud of dust, ejected from its icy nucleus warmed by increasing sunlight, is seen in this sharp image from the Hubble Space Telescope captured on July 21. Background stars are streaked in the exposure as Hubble tracked the fastest comet ever recorded on its journey toward the inner solar system. An analysis of the Hubble image indicates the solid nucleus, hidden from direct view, is likely less that 5.6 kilometers in diameter. This comet's interstellar origin is clear from its orbit, determined to be an eccentric, highly hyperbolic orbit that does not loop back around the Sun and will return 3I/ATLAS to interstellar space. Not a threat to planet Earth, the inbound interstellar interloper is now within the Jupiter's orbital distance of the Sun, while its closest approach to the Sun will bring it just inside the orbital distance of Mars.
Authors & editors: Robert Nemiroff (MTU) & Jerry Bonnell (UMCP)")
Alt...
2025 August 9
Interstellar Interloper 3I/ATLAS from Hubble
* Image Credit: NASA, ESA, David Jewitt (UCLA) et al. -
* Processing; Joseph DePasquale (STScI)
Explanation:
Discovered on July 1 with the NASA-funded ATLAS (Asteroid Terrestrial-impact Last Alert System) survey telescope in Rio Hurtado, Chile, 3I/ATLAS is so designated as the third known interstellar object to pass through our Solar System. It follows 1I/ʻOumuamua in 2017 and the comet 2I/Borisov in 2019. Also known as C/2025 N1, 3I/ATLAS is a comet. A teardrop-shaped cloud of dust, ejected from its icy nucleus warmed by increasing sunlight, is seen in this sharp image from the Hubble Space Telescope captured on July 21. Background stars are streaked in the exposure as Hubble tracked the fastest comet ever recorded on its journey toward the inner solar system. An analysis of the Hubble image indicates the solid nucleus, hidden from direct view, is likely less that 5.6 kilometers in diameter. This comet's interstellar origin is clear from its orbit, determined to be an eccentric, highly hyperbolic orbit that does not loop back around the Sun and will return 3I/ATLAS to interstellar space. Not a threat to planet Earth, the inbound interstellar interloper is now within the Jupiter's orbital distance of the Sun, while its closest approach to the Sun will bring it just inside the orbital distance of Mars.
Authors & editors: Robert Nemiroff (MTU) & Jerry Bonnell (UMCP)
As NASA Missions Study Interstellar Comet, Hubble Makes Size Estimate - NASA Science
--By Andrea Gianopoulos
A team of astronomers has taken the sharpest-ever picture of the unexpected interstellar comet 3I/ATLAS using the crisp vision of NASA’s Hubble Space Telescope. Hubble is one of many missions across NASA’s fleet of space telescopes slated to observe this comet, together providing more information about its size and physical properties. While the comet poses no threat to Earth, NASA’s space telescopes help support the agency's ongoing mission to find, track, and better understand near-Earth objects.
[...]
Video Credits:
+ Halley’s Comet Animation via Pond5
+ Milky Way Timelapse via Pond5
+ Comet Grazing the Sun (Tsuchinshan-ATLAS)
+ Exocomets in Solar System
ESO/L. Calçada/N. Risinger
+ Comets orbiting White Dwarf Star
ESA/Hubble, NASA, ESO, M. Kornmesser
+ Oumuamua Image
ESA/Hubble, NASA, ESO, M. Kornmesser
#comets #astrophotography #photography #science #astronomy #nature #NASA #ESA
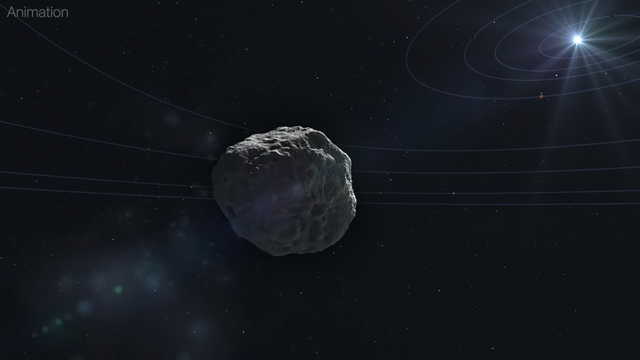
Alt...
The Hubble Space Telescope has been operating for more than three decades and continues to make ground-breaking discoveries that shape our fundamental understanding of the universe. Hubble is a project of international cooperation between NASA and ESA (European Space Agency). NASA’s Goddard Space Flight Center in Greenbelt, Maryland, manages the telescope and mission operations. Lockheed Martin Space, based in Denver, also supports mission operations at Goddard. The Space Telescope Science Institute in Baltimore, which is operated by the Association of Universities for Research in Astronomy, conducts Hubble science operations for NASA.
Video Credits:
+ Halley’s Comet Animation via Pond5
+ Milky Way Timelapse via Pond5
+ Comet Grazing the Sun (Tsuchinshan-ATLAS)
+ Exocomets in Solar System
ESO/L. Calçada/N. Risinger
+ Comets orbiting White Dwarf Star
ESA/Hubble, NASA, ESO, M. Kornmesser
+ Oumuamua Image
ESA/Hubble, NASA, ESO, M. Kornmesser
2025 October 5
A Long Storm System on Saturn
* Image Credit: NASA, JPL, ESA, Cassini Imaging Team, SSI
https://www.nasa.gov/
https://www.jpl.nasa.gov/
https://www.esa.int/
http://ciclops.org/
https://www.spacescience.org/
Explanation:
It was one of the largest and longest lived storms ever recorded in our Solar System. First seen in late 2010, the featured cloud formation in the northern hemisphere of Saturn started larger than the Earth and soon spread completely around the planet. The storm was tracked not only from Earth but from up close by the robotic Cassini spacecraft then orbiting Saturn. Pictured here in false colored infrared in February, orange colors indicate clouds deep in the atmosphere, while light colors highlight clouds higher up. The rings of Saturn are seen nearly edge-on as the thin blue horizontal line. The warped dark bands are the shadows of the rings cast onto the cloud tops by the Sun to the upper left. A source of radio noise from lightning, the intense storm was thought to relate to seasonal changes when spring emerges in the north of Saturn. After raging for over six months, the iconic storm circled the entire planet and then tried to absorb its own tail -- which surprisingly caused it to fade away.
https://www.jpl.nasa.gov/news/cassini-chronicles-life-of-saturns-giant-storm/
https://science.nasa.gov/photojournal/storm-tail-in-false-color/
https://en.wikipedia.org/wiki/Rings_of_Saturn
https://en.wikipedia.org/wiki/Rings_of_Saturn
https://apod.nasa.gov/apod/ap251005.html
#space #saturn #astrophotography #photography #science #astronomy #physics #nature #NASA

Alt...
2025 October 5
The planet Saturn is shown in infrared with great detail visible on its cloud tops. The rings appear as a thin blue horizontal line. She shadow of the rings appear as curving dark lines on the clouds. Near the top one of the tan cloud bands shows appears quite jumbled. Please see the explanation for more detailed information.
A Long Storm System on Saturn
* Image Credit: NASA, JPL, ESA, Cassini Imaging Team, SSI
Explanation:
It was one of the largest and longest lived storms ever recorded in our Solar System. First seen in late 2010, the featured cloud formation in the northern hemisphere of Saturn started larger than the Earth and soon spread completely around the planet. The storm was tracked not only from Earth but from up close by the robotic Cassini spacecraft then orbiting Saturn. Pictured here in false colored infrared in February, orange colors indicate clouds deep in the atmosphere, while light colors highlight clouds higher up. The rings of Saturn are seen nearly edge-on as the thin blue horizontal line. The warped dark bands are the shadows of the rings cast onto the cloud tops by the Sun to the upper left. A source of radio noise from lightning, the intense storm was thought to relate to seasonal changes when spring emerges in the north of Saturn. After raging for over six months, the iconic storm circled the entire planet and then tried to absorb its own tail -- which surprisingly caused it to fade away.
What Was The Grand Finale?
In April 2017, NASA's Cassini spacecraft began writing the final, thrilling chapter of its remarkable 20-year-long story of exploration: its Grand Finale.
Every week, Cassini dived through the approximately 1,200-mile-wide (2,000-kilometer-wide) gap between Saturn and its rings. No other spacecraft had ever explored this unique region.
A final close flyby of the moon Titan on April 22 used the moon's gravity to reshape Cassini's trajectory so that the spacecraft leapt over the planet's icy rings to pass between the rings and Saturn. During 22 such passes over about five months, the spacecraft's altitude above Saturn's clouds varied from about 1,000 to 2,500 miles (1,600 to 4,000 kilometers), thanks to occasional distant passes by Titan that shifted the closest approach distance. At times, Cassini skirted the very inner edge of the rings; at other times, it skimmed the outer edges of the atmosphere. During its final five orbits, its orbit passed through Saturn's uppermost atmosphere, before finally plunging directly into the planet on Sept. 15.
A Daring Dive
Cassini's Grand Finale was about so much more than the spacecraft's final dive into Saturn. That dramatic event was the capstone of six months of daring exploration and scientific discovery. And those six months were the thrilling final chapter in a historic 20-year journey.
At times, the spacecraft skirted the very inner edge of the rings; at other times, it skimmed the outer edges of the atmosphere. While the mission team was confident the risks were well understood, there could still have surprises. It was the kind of bold adventure that could only be undertaken at the end of the mission.
https://science.nasa.gov/mission/cassini/grand-finale/overview/
#space #saturn #astrophotography #photography #science #astronomy #physics #nature #NASA
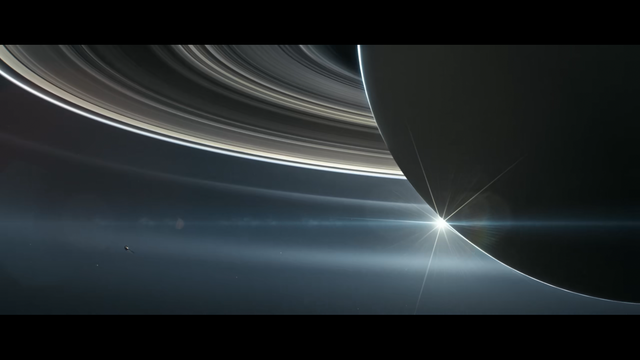
Alt...
A short, animated video describing the Cassini's Grand Finale.
In April 2017, NASA's Cassini spacecraft began writing the final, thrilling chapter of its remarkable 20-year-long story of exploration: its Grand Finale.
Every week, Cassini dived through the approximately 1,200-mile-wide (2,000-kilometer-wide) gap between Saturn and its rings. No other spacecraft had ever explored this unique region.
A final close flyby of the moon Titan on April 22 used the moon's gravity to reshape Cassini's trajectory so that the spacecraft leapt over the planet's icy rings to pass between the rings and Saturn. During 22 such passes over about five months, the spacecraft's altitude above Saturn's clouds varied from about 1,000 to 2,500 miles (1,600 to 4,000 kilometers), thanks to occasional distant passes by Titan that shifted the closest approach distance. At times, Cassini skirted the very inner edge of the rings; at other times, it skimmed the outer edges of the atmosphere. During its final five orbits, its orbit passed through Saturn's uppermost atmosphere, before finally plunging directly into the planet on Sept. 15.
CREDIT
NASA JPL
Starting a moon exploration tour from the couch? Why not? With a good internet connection, you can hit the ground running right away and enjoy your moonwalk:
https://trek.nasa.gov/moon/#v=0.1&x=0&y=0&z=1&p=urn%3Aogc%3Adef%3Acrs%3AEPSG%3A%3A104903&d=&locale=&b=moon&e=-281.2499947536844%2C-131.83593504078956%2C281.2499947536844%2C131.83593504078956&sfz=&w=
And don't forget: The Trump administration has cut off NASA's financial support from government funds! It stands to reason that this institution is to be weakened by financial erosion in order to then privatise it and sell it cheaply to loyal greedy super-rich. So no one can know how long all this information and data will be publicly available, which is now the property of the American people and the calling card for a United America. Do we really want to put up with THAT? This country is still called "United States of America" and may this name preserve its values for a long time to come! Stop freezing like the rabbit before the poison snake, stay strong and unite USA and finally defend yourself against your malicious destruction by greedy narcissists!
#space #moon #astrophotography #photography #science #astronomy #nature #NASA #education #us #uspol #trump #usa #europe #italy #france #unitedkingdom #resist

Alt...
Moon Trek allows you to explore the Moon via your own computer. Credit: NASA/SSERVI
Data and Music: What 50 Years of Exploring Our Moon Sounds Like
Sonification is the process of translating data into sound and music. In this musical data sonification of lunar knowledge and exploration, we can hear the progress made throughout the Apollo program to now as our understanding of the Moon expands. Listen to the percussion, which signals launches and the passage of time; the pitch of the string and brass instruments conveys the amount of scientific activity associated with the Moon over time.
Here’s a breakdown of the individual instruments:
Pitch of the string and brass = scientific activity
Percussion instruments = passage of time
Clock ticking = months
Snare drum = years
Bass drum = decades
Cymbals = launches
In the video, the blue line indicates the amount of scientific activity (the number of scientific publications, citations and patents) in each year that is related to NASA’s Apollo program. The red and yellow lines indicate the amount of scientific activity associated with Apollo samples and Apollo images, respectively. The other colors indicate the amount of scientific activity associated with each of NASA’s lunar robotic missions.
Each year's data represents the number of articles, citations and patents dated in that year and returned by Google Scholar when applying a certain set of keywords.
CREDIT
NASA's Goddard Space Flight Center
SYSTEM Sounds
Data sonification and visualization by Matt Russo and Andrew Santaguida of SYSTEM Sounds. Data compiled by NASA.
Music credits: "Giant Leaps" by SYSTEM Sounds
https://svs.gsfc.nasa.gov/13204
#space #moon #astrophotography #photography #science #astronomy #nature #NASA #education
You're Invited!
The next International Observe the Moon Night is tonight !
International Observe the Moon Night is a time to come together with fellow Moon enthusiasts and curious people worldwide. Everyone on Earth is invited to learn about lunar science and exploration, take part in celestial observations, and honor cultural and personal connections to the Moon. We encourage everyone to interpret “observe” broadly!
International Observe the Moon Night occurs annually in September or October, when the Moon is around first quarter ― a great phase for evening observing. A first-quarter Moon offers excellent viewing opportunities along the terminator (the line between night and day), where shadows enhance the Moon’s cratered landscape.
You can join International Observe the Moon Night from wherever you are. Attend or host a virtual or in-person event, or observe the Moon from home. Connect with fellow lunar enthusiasts around the world by using #ObserveTheMoon on your preferred social media platform and visiting the International Observe the Moon Night Flickr group.
Outdoors, at home, online, or wherever you may be, we’re glad to have you with us. However you choose to observe, please follow local guidelines on health and safety.
* Unite people across the globe in a celebration of lunar observation, science, and exploration.
* Provide information, a platform, and resources in order to:
* Raise awareness of NASA’s lunar science and exploration programs.
* Empower people to learn more about the Moon and space science and exploration, using Earth’s Moon as an accessible entry point.
* Facilitate sharing of Moon-inspired stories, images, artwork, and more.
* Inspire continued observation of the Moon, the sky, and the world around us.
* Support all people who are interested in learning more about, and connecting to, the Moon.
https://moon.nasa.gov/observe-the-moon-night/about/overview/
https://moon.nasa.gov/observe-the-moon-night/participate/10-ways-to-observe-the-moon/
#space #moon #astrophotography #photography #science #astronomy #nature #NASA #education
Alt...
Video trailer for International Observe the Moon Night 2025.
https://moon.nasa.gov/observe-the-moon-night/
Join In!
The countdown is on.. for the International Observe the Moon Night 2025 on October 4!
https://moon.nasa.gov/observe-the-moon-night/
https://moon.nasa.gov/observe-the-moon-night/register/individual-participation/
#space #moon #astrophotography #photography #science #astronomy #nature #NASA #education
nazgul is a joint effort by:
* J. Michael Burgess
* Ewan Cameron
* Dmitry Svinkin
Nazgul is a framework for performing GRB localization via fitting non-parametric models to their data time-series and computing the time delay between them. It is currentrly built upon the magic of Stan and implements a parallel version of non-stationary Random Fourier Features. The idea is get away from heuristic methods such as cross-correlation which do not have a self-consistent statitical model.
The idea is that satellites throughout the Sol system observe gamma-ray bursts at different times due to the finite speed of light. This creates a time delay in their observed light curves which can be used to triangulate the gamma-ray burst position on the sky. These triangulation create annuli or rings on the sky which Nazgul searches for so that it, in the darkness, it can bind them to a location on the sky.
Left image:
The heriarchical model is shown below and details can be found in here https://arxiv.org/abs/2009.08350. If you find the method and/or code useful in your research we ask that you please cite the paper.
Right image:
The sister program to simulate time-delayed light curves is pyIPN and can be used to generate time-delayed light curves for algorithm testing.
https://github.com/grburgess/pyipn
#space #code #python #science #astronomy #astrophysics #tech #NASA

Alt...
The heriarchical model is shown below and details can be found in here. If you find the method and/or code useful in your research we ask that you please cite the paper.

Alt...
The sister program to simulate time-delayed light curves is pyIPN and can be used to generate time-delayed light curves for algorithm testing.
Thanks to Sam Van Kooten
https://github.com/svank
wispr-analysis
Shared tools for WISPR data analysis
Some highlights
plot_utils.py
+ plot_WISPR:
Aims to be a versatile function that does the Right Thing for plotting WISPR images, with colorbar bounds that are adjusted for inner and outer FOV and for L2 or L3 images, a square-root-scaled colorbar, and WCS coordinate support
+ *_axis_dates: Helper util for labeling a temporal axis with dates.
+ plot_orbit:
Reads a directory (or nested set of directories) of WISPR files and plots a diagram showing the orbital path of PSP and the locations where images were taken, like this:
projections.py
+ reproject_to_radial: Proof-of-concept code for reprojecting data into a radial coordinate system (where each row of the output array is a radial line out from the Sun.
data_cleaning.py
+ dust_streak_filter: Code for identifying debris streaks in the WISPR images
+ clean_fits_files: Function to batch-run dust_streak_filter on a directory of images.
composites.py
+ gen_composite: Reprojects an inner- and outer-FOV image into a common coordinate system
utils.py
+ to_timestamp: Parse a timestamp from a handful of formats, including the timestamps inside WISPR headers, or entire WISPR filenames. Returns a numerical timestamp.
+ collect_files: Walks a directory of WISPR files (or a directory of subdirectories of WISPR images), identifies all the WISPR images, sorts them, and separates them by inner and outer FOVs.
+ ignore_fits_warnings: Suppresses the warnings Astropy raises when reading WISPR FITS files or parsing WCS data.
https://github.com/svank/wispr_analysis
Documentation:
https://svank.github.io/wispr_analysis/
#space #code #python #science #astronomy #astrophysics #tech #NASA
 of WISPR files and plots a diagram showing the orbital path of PSP and the locations where images were taken, like this:
projections.py
+ reproject_to_radial: Proof-of-concept code for reprojecting data into a radial coordinate system (where each row of the output array is a radial line out from the Sun.
data_cleaning.py
+ dust_streak_filter: Code for identifying debris streaks in the WISPR images
clean_fits_files: Function to batch-run dust_streak_filter on a directory of images.
composites.py
+ gen_composite: Reprojects an inner- and outer-FOV image into a common coordinate system
utils.py
+ to_timestamp: Parse a timestamp from a handful of formats, including the timestamps inside WISPR headers, or entire WISPR filenames. Returns a numerical timestamp.
+ collect_files: Walks a directory of WISPR files (or a directory of subdirectories of WISPR images), identifies all the WISPR images, sorts them, and separates them by inner and outer FOVs.
+ ignore_fits_warnings: Suppresses the warnings Astropy raises when reading WISPR FITS files or parsing WCS data.")
Alt...
Some highlights
plot_utils.py
+ plot_WISPR:
Aims to be a versatile function that does the Right Thing for plotting WISPR images, with colorbar bounds that are adjusted for inner and outer FOV and for L2 or L3 images, a square-root-scaled colorbar, and WCS coordinate support
*_axis_dates: Helper util for labeling a temporal axis with dates.
+ plot_orbit:
Reads a directory (or nested set of directories) of WISPR files and plots a diagram showing the orbital path of PSP and the locations where images were taken, like this:
projections.py
+ reproject_to_radial: Proof-of-concept code for reprojecting data into a radial coordinate system (where each row of the output array is a radial line out from the Sun.
data_cleaning.py
+ dust_streak_filter: Code for identifying debris streaks in the WISPR images
clean_fits_files: Function to batch-run dust_streak_filter on a directory of images.
composites.py
+ gen_composite: Reprojects an inner- and outer-FOV image into a common coordinate system
utils.py
+ to_timestamp: Parse a timestamp from a handful of formats, including the timestamps inside WISPR headers, or entire WISPR filenames. Returns a numerical timestamp.
+ collect_files: Walks a directory of WISPR files (or a directory of subdirectories of WISPR images), identifies all the WISPR images, sorts them, and separates them by inner and outer FOVs.
+ ignore_fits_warnings: Suppresses the warnings Astropy raises when reading WISPR FITS files or parsing WCS data.
2025-08-20
Leandro Beraldo e Silva released four days ago:
lberaldoesilva/tropygal version 0.1.4
Entropy estimates and distribution functions for galactic dynamics
tropygal is a pure-python package for entropy estimates in the context of galactic dynamics, but can be used in other contexts too. It also provides functions for analytical distribution functions and density of states for models that have analytical expressions.
** Acknowledgements
Development of tropygal was supported by the following research grants:
+ NASA ATP awards 80NSSC20K0509 and 80NSSC24K0938
+ U.S. NSF AAG grant AST-2009122
+ STFC Ernest Rutherford fellowship (ST/X004066/1)
+ JSPS KAKENHI Grant Numbers JP24K07101, JP21K13965, and JP21H00053
+ CNPq (309723/2020-5)
+ Heising Simons Foundation grant # 2022-3927
** Funding agencies:
+ NASA ATP - NASA Astrophysical Theory Program (US)
+ NSF - National Science Foundation (US)
+ STFC - Science and Technology Facilities Council (UK)
+ JSPS - Japan Society for the Promotion of Science (Japan)
+ CNPq – Conselho Nacional de Desenvolvimento Científico e Tecnológico (Brasil)
+ Heising Simons Foundation (US)
https://github.com/lberaldoesilva/tropygal
https://tropygal.readthedocs.io/en/latest/
https://link.springer.com/epdf/10.1007/BF00773669?sharing_token=c10vjrwKcPemuJugFt8GPPe4RwlQNchNByi7wbcMAY4It9IZvz0cQPRbyx9xcOC67oJ1uYrQB3lur75MCDwqdPXd8sWtzve-hL8JYGekYHqhITNJ3f12mXyjbTmMIqid10HwkWoYRAWdltK0BTwIew%3D%3D
https://www.mdpi.com/1099-4300/18/1/13
#space #code #python #science #astronomy #astrophysics #tech #NASA
Abell 2744: Pandora's Cluster Revealed
X-ray, Optical & Lensing Map Images of Abell 2744
One of the most complicated and dramatic collisions between galaxy clusters ever seen is captured in this new composite image. This collision site, known officially as Abell 2744, has been dubbed "Pandora's Cluster" because of the wide variety of different structures seen. Data from NASA's Chandra X-ray Observatory are colored red, showing gas with temperatures of millions of degrees. In blue is a map showing the total mass concentration (mostly dark matter) based on data from the Hubble Space Telescope (HST), the European Southern Observatory's Very Large Telescope (VLT), and the Japanese Subaru telescope. Optical data from HST and VLT also show the constituent galaxies of the clusters.
The "core" region shows a bullet-shaped structure in the X-ray emitting hot gas and a separation between the hot gas and the dark matter. (As a guide, local peaks in the distribution of hot gas and overall matter in the different regions are shown with red and blue circles respectively). This separation occurs because electric forces between colliding particles in the clouds of hot gas create a friction that slows them down, while dark matter is unaffected by such forces.
In the Northwest ("NW") region, a much larger separation is seen between the hot gas and the dark matter. Surprisingly, the hot gas leads the "dark" clump (mostly dark matter) by about 500,000 light years. [...]
https://chandra.harvard.edu/photo/2011/a2744/
CREDIT
X-ray: NASA/CXC/ITA/INAF/J.Merten et al
Lensing: NASA/STScI; NAOJ/Subaru; ESO/VLT
Optical: NASA/STScI/R.Dupke)
#space #cluster #astrophotography #photography #science #astronomy #physics #nature #NASA #education
 based on data from the Hubble Space Telescope, the Very Large Telescope, and the Japanese Subaru telescope. Optical data also show the constituent galaxies of the clusters. The \"core\" region shows a slightly bullet shaped structure in the X-ray emitting hot gas (the diving bird) and a separation between the hot gas and the dark matter. This separation occurs because electromagnetic forces between colliding particles in the clouds of hot gas create a friction that slows them down, while dark matter is unaffected by such forces")
Alt...
The composite image of galaxy cluster Abell 2744 showcases an array of distant galaxies, hot gas and other celestial objects. The image features a vibrant pink and blue-purple hue, which is prevalent throughout the galaxy cluster, creating a captivating contrast against the dark blue background. At the center of the image, there is a large hot pink gaseous shape, almost like a mottled bird, diving into the more blue-purple nebulous area. The gaseous, nebulous shapes are littered with bright white-yellow pops of light, like too many holiday lights on a tree. This object was created by one of the most complicated and dramatic collisions between galaxy clusters ever seen. It has been dubbed "Pandora's Cluster" because of the wide variety of different structures seen. Data from NASA's Chandra X-ray Observatory are colored pink-red, showing gas with temperatures of millions of degrees. In blue is a map showing the total mass concentration (mostly dark matter) based on data from the Hubble Space Telescope, the Very Large Telescope, and the Japanese Subaru telescope. Optical data also show the constituent galaxies of the clusters. The "core" region shows a slightly bullet shaped structure in the X-ray emitting hot gas (the diving bird) and a separation between the hot gas and the dark matter. This separation occurs because electromagnetic forces between colliding particles in the clouds of hot gas create a friction that slows them down, while dark matter is unaffected by such forces
 based on data from the Hubble Space Telescope, the Very Large Telescope (VLT), and the Subaru telescope. Optical data from HST and VLT also show the constituent galaxies of the clusters. Astronomers think at least four galaxy clusters coming from a variety of directions are involved with this collision.
CREDIT
X-ray: NASA/CXC/ITA/INAF/J.Merten et al,
Lensing: NASA/STScI; NAOJ/Subaru; ESO/VLT,
Optical: NASA/STScI/R.Dupke")
Alt...
Labeled image of Abell 2744
These images feature one of the most complicated and dramatic collisions between galaxy clusters ever seen. Known officially as Abell 2744, this system has been dubbed "Pandora's Cluster" because of the wide variety of different structures found. Data from Chandra show gas with temperatures of millions of degrees. Next is a map showing the total mass concentration (mostly dark matter) based on data from the Hubble Space Telescope, the Very Large Telescope (VLT), and the Subaru telescope. Optical data from HST and VLT also show the constituent galaxies of the clusters. Astronomers think at least four galaxy clusters coming from a variety of directions are involved with this collision.
CREDIT
X-ray: NASA/CXC/ITA/INAF/J.Merten et al,
Lensing: NASA/STScI; NAOJ/Subaru; ESO/VLT,
Optical: NASA/STScI/R.Dupke

Alt...
LMap image of Abell 2744
CREDIT
X-ray: NASA/CXC/ITA/INAF/J.Merten et al,
Lensing: NASA/STScI; NAOJ/Subaru; ESO/VLT,
Optical: NASA/STScI/R.Dupke

Alt...
X-ray image of Abell 2744
CREDIT
X-ray: NASA/CXC/ITA/INAF/J.Merten et al,
Lensing: NASA/STScI; NAOJ/Subaru; ESO/VLT,
Optical: NASA/STScI/R.Dupke
... [SENSITIVE CONTENT]
Due to the lapse in federal government funding, NASA is not updating these websites:
Piñata
Image of a piñata for NASA Apod's 30th anniversary year. One blow from every citizen for every information destroyed, 10 for every destroyed job and 100 for every pupil, student and interested citizen who have given their taxes for the construction, development and maintenance of this wonderful institution and who will no longer be able to use its educational share in the future.
And which is now to be belittled by the current US government in order to then sell it cheaply to loyal super-rich.
THANK YOU DONALD TRUMP YOU MAKE AMERICA SUCK AGAIN!
https://www.nasa.gov/
https://www.nasa.gov/missions/station/iss-research/international-space-station-launching-nasa-and-humanity-into-deep-space/
https://plus.nasa.gov/
https://spaceplace.nasa.gov/
https://science.nasa.gov/skywatching/whats-up/
https://apod.nasa.gov/apod/ap251003.html
https://apod.nasa.gov/apod/calendar/ca2510.html
https://www.nasa.gov/live/
https://www.nasa.gov/news/recently-published/
https://plus.nasa.gov/scheduled-video/nasas-spacex-crew-10-re-entry-and-splashdown/
https://www.nasa.gov/learning-resources/
https://www.nasa.gov/es/
https://science.nasa.gov/solar-system/
https://www.nasa.gov/humans-in-space/
https://www.nasa.gov/aeronautics/
https://www.nasa.gov/technology/
https://www.nasa.gov/multimedia/
https://moon.nasa.gov/observe-the-moon-night/
#uspol #us #trump #politics #europe #germany #unitedkingdom #france #italy #ccc #fefe #NASA

Alt...
Piñata
Image of a piñata for NASA Apod's 30th anniversary year. One blow from every citizen for every information destroyed, 10 for every destroyed job and 100 for every pupil, student and interested citizen who have given their taxes for the construction, development and maintenance of this wonderful institution and who will no longer be able to use its educational share in the future.
And which is now to be belittled by the current US government in order to then sell it cheaply to loyal super-rich.
THANK YOU DONALD TRUMP YOU MAKE AMERICA SUCK AGAIN!
Gravity – Nature’s Magnifying Glass
This video explains how very distant galaxies are magnified through the phenomenon of gravitational lensing. Gravitational lenses can magnify the light from distant galaxies that are at or near the peak of star formation. This effect allows researchers to study the details of early galaxies too far away to be seen with even the most powerful space telescopes.
Credit
NASA, ESA, CSA, STScI, Leah Hustak (STScI)
https://science.nasa.gov/asset/webb/gravity-natures-magnifying-glass/ <- Due to the lapse in federal government funding, NASA is not updating this website.
#space #galaxy #astrophotography #photography #science #physics #nature #NASA #ESA #education
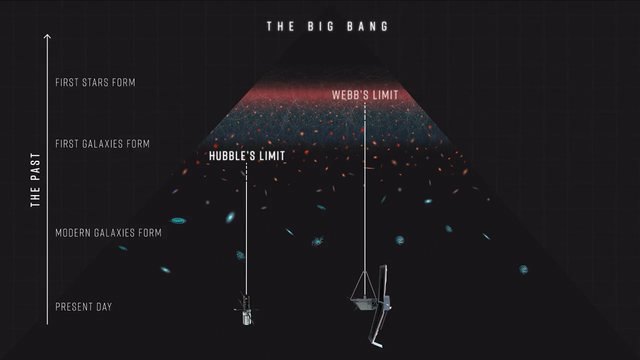
Alt...
This video explains how very distant galaxies are magnified through the phenomenon of gravitational lensing. Gravitational lenses can magnify the light from distant galaxies that are at or near the peak of star formation. This effect allows researchers to study the details of early galaxies too far away to be seen with even the most powerful space telescopes.
Credit
NASA, ESA, CSA, STScI, Leah Hustak (STScI)
Take a Tour of Pandora’s Cluster
This video tours Pandora’s Cluster (Abell 2744), a region where multiple clusters of galaxies are in the process of merging to form a megacluster. Astronomers estimate 50,000 sources of near-infrared light are represented in this image from NASA’s James Webb Space Telescope.
The concentration of mass in Pandora’s Cluster is so great that the fabric of spacetime is warped by gravity, creating an effect that makes the region of special interest to astronomers: a natural, super-magnifying glass called a “gravitational lens” that they can use to see very distant sources of light beyond the cluster that would otherwise be undetectable, even to Webb. These lensed sources, which are particularly prominent in the lower right area, appear red in the image, and often as elongated arcs distorted by the gravitational lens.
The video also highlights a mysterious object that appears to be no more than a red dot. One theory is that this source of infrared light is a glowing disk of gas surrounding a supermassive black hole in the early universe.
Credit
Video: STScI, Danielle Kirshenblat; Music: PremiumBeat Music, Klaus Hergersheimer; Science: Ivo Labbe (Swinburne), Rachel Bezanson (University of Pittsburgh); Image Processing: STScI, Alyssa Pagan
https://science.nasa.gov/asset/webb/take-a-tour-of-pandoras-cluster/ <- Due to the lapse in federal government funding, NASA is not updating this website.
#space #cluster #astrophotography #photography #science #astronomy #physics #nature #NASA
2025 October 3
Pandora's Cluster of Galaxies
* Image Credit: NASA, ESA, CSA, Ivo Labbe (Swinburne), Rachel Bezanson (University of Pittsburgh)
https://www.nasa.gov/
https://www.esa.int/
https://www.asc-csa.gc.ca/eng/
* Processing: Alyssa Pagan (STScI)
https://www.stsci.edu/
Explanation:
This deep field mosaicked image presents a stunning view of galaxy cluster Abell 2744 recorded by the James Webb Space Telescope's NIRCam. Also dubbed Pandora's Cluster, Abell 2744 itself appears to be a ponderous merger of three different massive galaxy clusters. It lies some 3.5 billion light-years away, toward the constellation Sculptor. Dominated by dark matter, the mega-cluster warps and distorts the fabric of spacetime, gravitationally lensing even more distant objects. Redder than the Pandora cluster galaxies, many of the lensed sources are very distant galaxies in the early Universe, their lensed images stretched and distorted into arcs. Of course, distinctive diffraction spikes mark foreground Milky Way stars. At the Pandora Cluster's estimated distance, this cosmic box spans about 6 million light-years. But don't panic. You can explore the tantalizing region in a 2 minute video tour.
https://science.nasa.gov/missions/webb/nasas-webb-uncovers-new-details-in-pandoras-cluster/
FYI in Gravitational Lensing you might want to see:
https://defcon.social/@grobi/114374350096488478
https://apod.nasa.gov/apod/fap/ap220319.html
https://apod.nasa.gov/apod/ap251003.html <- Due to the lapse in federal government funding, NASA is not updating this website.
#NASA #inofficial #space #cluster #astrophotography #photography #science #astronomy #physics #nature
, Rachel Bezanson (University of Pittsburgh)
* Processing: Alyssa Pagan (STScI)
Explanation:
This deep field mosaicked image presents a stunning view of galaxy cluster Abell 2744 recorded by the James Webb Space Telescope's NIRCam. Also dubbed Pandora's Cluster, Abell 2744 itself appears to be a ponderous merger of three different massive galaxy clusters. It lies some 3.5 billion light-years away, toward the constellation Sculptor. Dominated by dark matter, the mega-cluster warps and distorts the fabric of spacetime, gravitationally lensing even more distant objects. Redder than the Pandora cluster galaxies, many of the lensed sources are very distant galaxies in the early Universe, their lensed images stretched and distorted into arcs. Of course, distinctive diffraction spikes mark foreground Milky Way stars. At the Pandora Cluster's estimated distance, this cosmic box spans about 6 million light-years. But don't panic. You can explore the tantalizing region in a 2 minute video tour.
Authors & editors: Robert Nemiroff (MTU) & Jerry Bonnell (UMCP)
NASA Official: Amber Straughn Specific rights apply.
NASA Web Privacy, Accessibility, Notices;
A service of: ASD at NASA / GSFC,
NASA Science Activation
& Michigan Tech. U.")
Alt...
2025 October 3
Pandora's Cluster of Galaxies
* Image Credit: NASA, ESA, CSA, Ivo Labbe (Swinburne), Rachel Bezanson (University of Pittsburgh)
* Processing: Alyssa Pagan (STScI)
Explanation:
This deep field mosaicked image presents a stunning view of galaxy cluster Abell 2744 recorded by the James Webb Space Telescope's NIRCam. Also dubbed Pandora's Cluster, Abell 2744 itself appears to be a ponderous merger of three different massive galaxy clusters. It lies some 3.5 billion light-years away, toward the constellation Sculptor. Dominated by dark matter, the mega-cluster warps and distorts the fabric of spacetime, gravitationally lensing even more distant objects. Redder than the Pandora cluster galaxies, many of the lensed sources are very distant galaxies in the early Universe, their lensed images stretched and distorted into arcs. Of course, distinctive diffraction spikes mark foreground Milky Way stars. At the Pandora Cluster's estimated distance, this cosmic box spans about 6 million light-years. But don't panic. You can explore the tantalizing region in a 2 minute video tour.
Authors & editors: Robert Nemiroff (MTU) & Jerry Bonnell (UMCP)
NASA Official: Amber Straughn Specific rights apply.
NASA Web Privacy, Accessibility, Notices;
A service of: ASD at NASA / GSFC,
NASA Science Activation
& Michigan Tech. U.