Search results for tag #space
![[?]](https://files.defcon.social/dcsocial-s3/accounts/avatars/113/208/344/507/078/943/original/014820ad22daee1c.jpg)
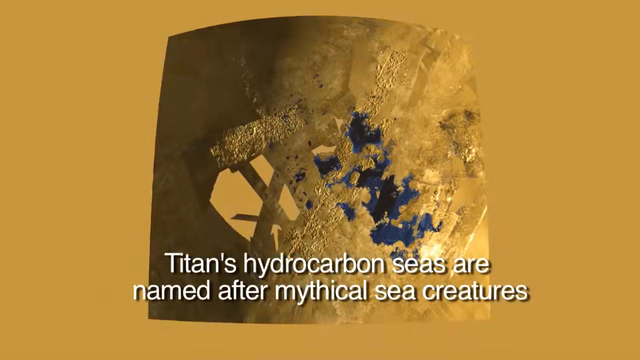
Soaring over Titan
* Video Credit: Cassini Radar Mapper, JPL, USGS, ESA, NASA
https://science.nasa.gov/mission/cassini/spacecraft/cassini-orbiter/
(for this post a compressed version of the featured video has been used ..)
Explanation:
What would it look like to fly over Titan? Radar images from NASA's robotic Cassini satellite in orbit around Saturn have been digitally compiled to simulate such a flight. Cassini has swooped past Saturn's cloudiest moon several times since it arrived at the ringed planet in 2004. The virtual flight featured here shows numerous lakes colored black and mountainous terrain colored tan. Surface regions without detailed vertical information appear more flat, while sufficiently mapped regions have their heights digitally stretched. Among the basins visualized is Kraken Mare, Titan's largest lake which spans over 1,000 kilometers long. Titan's lakes are different from Earth's lakes in that they are composed of hydrocarbons with similarities to liquid natural gas. How Titan's lakes were created and why they survive continues to be a topic of research.
https://en.wikipedia.org/wiki/Titan_(moon)
https://en.wikipedia.org/wiki/Hydrocarbon
https://en.wikipedia.org/wiki/Natural_gas
https://en.wikipedia.org/wiki/Kraken
https://apod.nasa.gov/apod/ap141124.html
#space #moon #titan #science #nature
Alt...
* This is a compressed version of the video
Soaring over Titan
* Video Credit: Cassini Radar Mapper, JPL, USGS, ESA, NASA
Explanation:
What would it look like to fly over Titan? Radar images from NASA's robotic Cassini satellite in orbit around Saturn have been digitally compiled to simulate such a flight. Cassini has swooped past Saturn's cloudiest moon several times since it arrived at the ringed planet in 2004. The virtual flight featured here shows numerous lakes colored black and mountainous terrain colored tan. Surface regions without detailed vertical information appear more flat, while sufficiently mapped regions have their heights digitally stretched. Among the basins visualized is Kraken Mare, Titan's largest lake which spans over 1,000 kilometers long. Titan's lakes are different from Earth's lakes in that they are composed of hydrocarbons with similarities to liquid natural gas. How Titan's lakes were created and why they survive continues to be a topic of research.
Authors & editors: Robert Nemiroff (MTU) & Jerry Bonnell (UMCP)
NASA Official: Phillip Newman Specific rights apply.
NASA Web Privacy Policy and Important Notices
A service of: ASD at NASA / GSFC
& Michigan Tech. U.
Huygens Lands on Titan
* Image Credit: ESA / NASA / JPL / University of Arizona
Explanation:
Delivered by Saturn-bound Cassini, ESA's Huygens probe touched down on the ringed planet's largest moon Titan, ten years ago on January 14, 2005. These panels show fisheye images made during its slow descent by parachute through Titan's dense atmosphere. Taken by the probe's descent imager/spectral radiometer instrument they range in altitude from 6 kilometers (upper left) to 0.2 kilometers (lower right) above the moon's surprisingly Earth-like surface of dark channels, floodplains, and bright ridges. But at temperatures near -290 degrees F (-180 degrees C), the liquids flowing across Titan's surface are methane and ethane, hydrocarbons rather than water. After making the most distant landing for a spacecraft from Earth, Huygens transmitted data for more than an hour. The Huygens data and a decade of exploration by Cassini have shown Titan to be a tantalizing world hosting a complex chemistry of organic compounds, dynamic landforms, lakes, seas, and a possible subsurface ocean of liquid water.
#space #moon #titan #astrophotography #photography #science #nature #NASA
 to 0.2 kilometers (lower right) above the moon's surprisingly Earth-like surface of dark channels, floodplains, and bright ridges. But at temperatures near -290 degrees F (-180 degrees C), the liquids flowing across Titan's surface are methane and ethane, hydrocarbons rather than water. After making the most distant landing for a spacecraft from Earth, Huygens transmitted data for more than an hour. The Huygens data and a decade of exploration by Cassini have shown Titan to be a tantalizing world hosting a complex chemistry of organic compounds, dynamic landforms, lakes, seas, and a possible subsurface ocean of liquid water.
Authors & editors: Robert Nemiroff (MTU) & Jerry Bonnell (UMCP)
NASA Official: Phillip Newman Specific rights apply.
NASA Web Privacy Policy and Important Notices
A service of: ASD at NASA / GSFC
& Michigan Tech. U.")
Alt...
2015 January 16
.
Huygens Lands on Titan
* Image Credit: ESA / NASA / JPL / University of Arizona
Explanation:
Delivered by Saturn-bound Cassini, ESA's Huygens probe touched down on the ringed planet's largest moon Titan, ten years ago on January 14, 2005. These panels show fisheye images made during its slow descent by parachute through Titan's dense atmosphere. Taken by the probe's descent imager/spectral radiometer instrument they range in altitude from 6 kilometers (upper left) to 0.2 kilometers (lower right) above the moon's surprisingly Earth-like surface of dark channels, floodplains, and bright ridges. But at temperatures near -290 degrees F (-180 degrees C), the liquids flowing across Titan's surface are methane and ethane, hydrocarbons rather than water. After making the most distant landing for a spacecraft from Earth, Huygens transmitted data for more than an hour. The Huygens data and a decade of exploration by Cassini have shown Titan to be a tantalizing world hosting a complex chemistry of organic compounds, dynamic landforms, lakes, seas, and a possible subsurface ocean of liquid water.
Authors & editors: Robert Nemiroff (MTU) & Jerry Bonnell (UMCP)
NASA Official: Phillip Newman Specific rights apply.
NASA Web Privacy Policy and Important Notices
A service of: ASD at NASA / GSFC
& Michigan Tech. U.
Potentially Habitable Moons
* Image Credit: Research and compilation - René Heller (McMaster Univ.) et al.
https://arxiv.org/search/astro-ph?searchtype=author&query=Heller,+R
Panels - NASA/JPL/Space Science Institute - Copyright: Ted Stryk
https://planetimages.blogspot.com/
Explanation:
For astrobiologists, these may be the four most tantalizing moons in our Solar System. Shown at the same scale, their exploration by interplanetary spacecraft has launched the idea that moons, not just planets, could have environments supporting life. The Galileo mission to Jupiter discovered Europa's global subsurface ocean of liquid water and indications of Ganymede's interior seas. At Saturn, the Cassini probe detected erupting fountains of water ice from Enceladus indicating warmer subsurface water on even that small moon, while finding surface lakes of frigid but still liquid hydrocarbons beneath the dense atmosphere of large moon Titan. Now looking beyond the Solar System, new research suggests that sizable exomoons, could actually outnumber exoplanets in stellar habitable zones. That would make moons the most common type of habitable world in the Universe.
https://apod.nasa.gov/apod/ap140919.html
Formation, Habitability, and Detection of Extrasolar Moons
The diversity and quantity of moons in the Solar System suggest a manifold population of natural satellites exist around extrasolar planets. Of peculiar interest from an astrobiological perspective, the number of sizable moons in the stellar habitable zones may outnumber planets in these circumstellar regions. With technological and theoretical methods now allowing for the detection of sub-Earth-sized extrasolar planets, the first detection of an extrasolar moon appears feasible. ..
>>
https://arxiv.org/abs/1408.6164
#space #moon #titan #astrophotography #photography #science #astronomy #astrobioligy #nature #NASA
 et al.
Panels - NASA/JPL/Space Science Institute - Copyright: Ted Stryk
Explanation:
For astrobiologists, these may be the four most tantalizing moons in our Solar System. Shown at the same scale, their exploration by interplanetary spacecraft has launched the idea that moons, not just planets, could have environments supporting life. The Galileo mission to Jupiter discovered Europa's global subsurface ocean of liquid water and indications of Ganymede's interior seas. At Saturn, the Cassini probe detected erupting fountains of water ice from Enceladus indicating warmer subsurface water on even that small moon, while finding surface lakes of frigid but still liquid hydrocarbons beneath the dense atmosphere of large moon Titan. Now looking beyond the Solar System, new research suggests that sizable exomoons, could actually outnumber exoplanets in stellar habitable zones. That would make moons the most common type of habitable world in the Universe.
Authors & editors: Robert Nemiroff (MTU) & Jerry Bonnell (UMCP)
NASA Official: Phillip Newman Specific rights apply.
NASA Web Privacy Policy and Important Notices
A service of: ASD at NASA / GSFC
& Michigan Tech. U.")
Alt...
Potentially Habitable Moons
* Image Credit: Research and compilation - René Heller (McMaster Univ.) et al.
Panels - NASA/JPL/Space Science Institute - Copyright: Ted Stryk
Explanation:
For astrobiologists, these may be the four most tantalizing moons in our Solar System. Shown at the same scale, their exploration by interplanetary spacecraft has launched the idea that moons, not just planets, could have environments supporting life. The Galileo mission to Jupiter discovered Europa's global subsurface ocean of liquid water and indications of Ganymede's interior seas. At Saturn, the Cassini probe detected erupting fountains of water ice from Enceladus indicating warmer subsurface water on even that small moon, while finding surface lakes of frigid but still liquid hydrocarbons beneath the dense atmosphere of large moon Titan. Now looking beyond the Solar System, new research suggests that sizable exomoons, could actually outnumber exoplanets in stellar habitable zones. That would make moons the most common type of habitable world in the Universe.
Authors & editors: Robert Nemiroff (MTU) & Jerry Bonnell (UMCP)
NASA Official: Phillip Newman Specific rights apply.
NASA Web Privacy Policy and Important Notices
A service of: ASD at NASA / GSFC
& Michigan Tech. U.
Remember the Titan (Landing): Twenty years ago today, Jan. 14, 2005, the Huygens probe touched down on Saturn's largest moon, Titan.
This new, narrated movie was created with data collected by Cassini's imaging cameras and the Huygens Descent Imager/Spectral Radiometer (DISR). The first minute shows a zoom into images of Titan from Cassini's cameras, while the remainder of the movie depicts the view from Huygens during the last few hours of its historic descent and landing.
It was October 15, 1997, when NASA's Cassini orbiter embarked on an epic, seven-year voyage to the Saturnian system. Hitching a ride was ESA's Huygens probe, destined for Saturn's largest moon, Titan. The final chapter of the interplanetary trek for Huygens began on 25 December 2004 when it deployed from the orbiter for a 21-day solo cruise toward the haze-shrouded moon. Plunging into Titan's atmosphere, on January 14 2005, the probe survived the hazardous 2 hour 27 minute descent to touch down safely on Titan’s frozen surface. Today, the Cassini spacecraft remains in orbit at Saturn. Its mission will end in 2017, 20 years after its journey began. More information and images from the mission at http://saturn.jpl.nasa.gov
#space #moon #titan #astrophotography #photography #science #astronomy #nature #NASA
2025 July 24
Titan Shadow Transit
* Image Credit & Copyright: Volodymyr Andrienko
Explanation:
Every 15 years or so, Saturn's rings are tilted edge-on to our line of sight. As the bright, beautiful ring system grows narrower and fainter it becomes increasingly difficult to see for denizens of planet Earth. But it does provide the opportunity to watch transits of Saturn's moons and their dark shadows across the ringed gas giant's still bright disk. Of course Saturn's largest moon Titan is the easiest to spot in transit. In this telescopic snapshot from July 18, Titan itself is at the upper left, casting a round dark shadow on Saturn's banded cloudtops above the narrow rings. In fact Titan's transit season is in full swing now with shadow transits every 16 days corresponding to the moon's orbital period. Its final shadow transit will be on October 6, though Titan's pale disk will continue to cross in front of Saturn as seen from telescopes on planet Earth every 16 days through January 25, 2026.
https://apod.nasa.gov/apod/ap250724.html
#space #moon #titan #astrophotography #photography #science #astronomy #nature #NASA
 & Jerry Bonnell (UMCP)
NASA Official: Amber Straughn Specific rights apply.
NASA Web Privacy, Accessibility, Notices;
A service of: ASD at NASA / GSFC,
NASA Science Activation
& Michigan Tech. U.")
Alt...
2025 July 24
Titan Shadow Transit
* Image Credit & Copyright: Volodymyr Andrienko
Explanation:
Every 15 years or so, Saturn's rings are tilted edge-on to our line of sight. As the bright, beautiful ring system grows narrower and fainter it becomes increasingly difficult to see for denizens of planet Earth. But it does provide the opportunity to watch transits of Saturn's moons and their dark shadows across the ringed gas giant's still bright disk. Of course Saturn's largest moon Titan is the easiest to spot in transit. In this telescopic snapshot from July 18, Titan itself is at the upper left, casting a round dark shadow on Saturn's banded cloudtops above the narrow rings. In fact Titan's transit season is in full swing now with shadow transits every 16 days corresponding to the moon's orbital period. Its final shadow transit will be on October 6, though Titan's pale disk will continue to cross in front of Saturn as seen from telescopes on planet Earth every 16 days through January 25, 2026.
Authors & editors: Robert Nemiroff (MTU) & Jerry Bonnell (UMCP)
NASA Official: Amber Straughn Specific rights apply.
NASA Web Privacy, Accessibility, Notices;
A service of: ASD at NASA / GSFC,
NASA Science Activation
& Michigan Tech. U.
Titan Shadow Transit Season Underway
By Bob King
[...]
Titan transits occur only during the relatively brief time Earth and Saturn both lie nearly on the same plane, which coincides with when the rings appear approximately edge-on. Currently, we see the rings' south side, with the ring plane tilted between 2.7° (May 14th) and 3.2° (May 31st). The rings have been difficult to tease out since the planet's return to the morning sky. Not only have they been backlit by the Sun until recently, but Saturn also continues to lay low in the eastern sky at dawn, especially from mid-northern latitudes. Poor seeing coupled with bright twilight have made it difficult to discern much more than a pale-yellow ball. I finally succeeded on May 14th, when the rings flickered in and out of sight in my 10-inch Dob at 168×. They were nothing short of wispy — on the verge of invisibility.
Shadow transits are common at Jupiter, and they occur when one (or more) of the four Galilean satellites casts its shadow on the gas giant's cloud tops. The size of the dark spot is closely related to the size of the moon. Ganymede is the largest, with an apparent diameter of about 1.7″, and Europa the smallest at about 1.0″. Through the telescope, Ganymede's shadow is a definitive black dot, while Europa looks more like a pinpoint.
[...]
https://skyandtelescope.org/astronomy-news/observing-news/titan-shadow-transit-season-underway/
#space #moon #titan #astrophotography #photography #science #astronomy #nature #NASA

Alt...
The last Titan shadow transit series took place in 2009. Amateur astronomer Bill Weir made this sketch of Titan's shadow on April 13th that year, using a 6-inch f/8 telescope and magnification of 240×.
Bill Weir
 and its dark shadow cross Saturn's disk on February 24, 2009, in this photo made with the 24-inch RCOS telescope at the University of Arizona SkyCenter on Mount Lemmon. Dione appears above the ring plane at left.
CREDIT
Sid Leach, Adam Block, and Francisco Arabia")
Alt...
Titan (smaller pale spot to left) and its dark shadow cross Saturn's disk on February 24, 2009, in this photo made with the 24-inch RCOS telescope at the University of Arizona SkyCenter on Mount Lemmon. Dione appears above the ring plane at left.
CREDIT
Sid Leach, Adam Block, and Francisco Arabia
[...]
Saturn's moons likewise cast shadows, with Titan's the easiest to see because it's the largest, with an apparent diameter of 0.8″at opposition on September 21st. This means you'll want to use at least a 3-inch telescope and magnification of 200× or more to discern the inky speck. At times, both moon and shadow will occupy the disk simultaneously. Titan itself appears somewhat smaller than its shadow and paler in tone. Even after the shadow portion of the transit series ends on October 6th, you can continue to observe the moon pass in front of Saturn every 16 days, through January 25, 2026.
When the current transit series began last November, timing favored Eastern Hemisphere observers. Now through early October, skywatchers in the Americas will get a crack at the shadow. Most of the transits occur after midnight, especially for the eastern half of the U.S. The table above lists the Universal Times (UT) of the start, midpoint, and end of each event. To convert to local times, use this UTC time zone converter https://dateful.com/convert/utc.
Notice that the transits occur every 16 days, which is Titan's orbital period.
Titan and its shadow gradually migrate northward across Saturn's oblate disk this spring and summer. The May 15th transit occurs across the planet's Equatorial Zone (EZ) and lasts nearly 6 hours. But on October 6th, when Titan's shadow nibbles the northern limb, the event lasts only about 2 hours.
[...]
Exerpt from:
"Titan Shadow Transit Season Underway"
By Bob King
https://skyandtelescope.org/astronomy-news/observing-news/titan-shadow-transit-season-underway/
#space #moon #titan #astrophotography #photography #science #astronomy #nature #NASA

Date Start Mid-transit End
May 15 9:49 12:59 15:44
May 31 9:05 12:12 14:53
June 16 8:21 11:24 14:00
July 2 7:40 10:35 13:03
July 18 7:00 9:44 12:05
Aug. 3 6:25 8:52 11:04
Aug. 19 5:52 8:01 10:00
Sept. 4 5:25 7:09 8:50
Sept. 20 5:09 6:20 7:34
Oct. 6 5:32*
Start and end times are when Titan's full shadow is first and last visible entering and exiting Saturn's disk, respectively. * Full shadow on disk only at mid-transit")
Alt...
These simulated views show Titan's shadow at mid-transit on the dates indicated. The shadow migrates north during the time, finally departing the disk after October 6th.
Diagrams created with WinJUPOS
Upcoming titan shadow transits (UT)
Date Start Mid-transit End
May 15 9:49 12:59 15:44
May 31 9:05 12:12 14:53
June 16 8:21 11:24 14:00
July 2 7:40 10:35 13:03
July 18 7:00 9:44 12:05
Aug. 3 6:25 8:52 11:04
Aug. 19 5:52 8:01 10:00
Sept. 4 5:25 7:09 8:50
Sept. 20 5:09 6:20 7:34
Oct. 6 5:32*
Start and end times are when Titan's full shadow is first and last visible entering and exiting Saturn's disk, respectively. * Full shadow on disk only at mid-transit
2009 March 19
Saturn: Moons in Transit
* Credit: NASA, ESA, Hubble Heritage Team (STScI/AURA)
http://www.nasa.gov/
http://www.spacetelescope.org/
http://heritage.stsci.edu/
* Acknowledgment: M.H. Wong (STScI/UC Berkeley), C. Go (Philippines)
https://www.stsci.edu/contents/news-releases/2024/news-2024-401?user=birkmann
Explanation:
Every 14 to 15 years, Saturn's rings are tilted edge-on to our line of sight. As the bright, beautiful rings seem to grow narrower it becomes increasingly difficult to see them, even with large telescopes. But it does provide the opportunity to watch multiple transits of Saturn's moons. During a transit, a sunlit moon and its shadow glide across the cloudy face of the gas giant. Recorded on February 24, this Hubble image is part of a sequence showing the transit of four of Saturn's moons. From left to right are Enceladus and shadow, Dione and shadow, and Saturn's largest moon Titan. Small moon Mimas is just touching Saturn's disk near the ring plane at the far right. The shadows of Titan and Mimas have both moved off the right side of the disk. Saturn itself has an equatorial diameter of about 120,000 kilometers.
https://apod.nasa.gov/apod/ap090319.html
#space #moon #titan #astrophotography #photography #science #astronomy #nature #NASA

* Acknowledgment: M.H. Wong (STScI/UC Berkeley), C. Go (Philippines)
Explanation:
Every 14 to 15 years, Saturn's rings are tilted edge-on to our line of sight. As the bright, beautiful rings seem to grow narrower it becomes increasingly difficult to see them, even with large telescopes. But it does provide the opportunity to watch multiple transits of Saturn's moons. During a transit, a sunlit moon and its shadow glide across the cloudy face of the gas giant. Recorded on February 24, this Hubble image is part of a sequence showing the transit of four of Saturn's moons. From left to right are Enceladus and shadow, Dione and shadow, and Saturn's largest moon Titan. Small moon Mimas is just touching Saturn's disk near the ring plane at the far right. The shadows of Titan and Mimas have both moved off the right side of the disk. Saturn itself has an equatorial diameter of about 120,000 kilometers.
Authors & editors: Robert Nemiroff (MTU) & Jerry Bonnell (UMCP)
NASA Official: Phillip Newman Specific rights apply.
NASA Web Privacy Policy and Important Notices
A service of: ASD at NASA / GSFC
& Michigan Tech. U.")
Alt...
2009 March 19
Saturn: Moons in Transit
* Credit: NASA, ESA, Hubble Heritage Team (STScI/AURA)
* Acknowledgment: M.H. Wong (STScI/UC Berkeley), C. Go (Philippines)
Explanation:
Every 14 to 15 years, Saturn's rings are tilted edge-on to our line of sight. As the bright, beautiful rings seem to grow narrower it becomes increasingly difficult to see them, even with large telescopes. But it does provide the opportunity to watch multiple transits of Saturn's moons. During a transit, a sunlit moon and its shadow glide across the cloudy face of the gas giant. Recorded on February 24, this Hubble image is part of a sequence showing the transit of four of Saturn's moons. From left to right are Enceladus and shadow, Dione and shadow, and Saturn's largest moon Titan. Small moon Mimas is just touching Saturn's disk near the ring plane at the far right. The shadows of Titan and Mimas have both moved off the right side of the disk. Saturn itself has an equatorial diameter of about 120,000 kilometers.
Authors & editors: Robert Nemiroff (MTU) & Jerry Bonnell (UMCP)
NASA Official: Phillip Newman Specific rights apply.
NASA Web Privacy Policy and Important Notices
A service of: ASD at NASA / GSFC
& Michigan Tech. U.
2005 October 21
Ringside
* Credit : Cassini Imaging Team, SSI, JPL, ESA, NASA
http://ciclops.org/
http://www.spacescience.org/
http://www.jpl.nasa.gov/
http://www.esa.int/
http://www.nasa.gov/home/index.html
Explanation:
Orbiting in the plane of Saturn's rings, Dione and the other icy saturnian moons have a perpetual ringside view of the gorgeous gas giant planet. Of course, while passing through the ring plane the Cassini spacecraft also shares their stunning perspective. The rings themselves can be seen slicing across the bottom of this Cassini snapshot. Remarkably thin, the bright rings still cast arcing shadows across the planet's cloud tops. Pale Dione, in the foreground, is about 1,100 kilometers across and orbits over 300,000 kilometers from the visible outer edge of the A ring.
https://apod.nasa.gov/apod/ap051021.html
#space #moon #Dione #saturn #astrophotography #photography #science #astronomy #nature #NASA
 & Jerry Bonnell (USRA)
NASA Web Site Statements, Warnings, and Disclaimers
NASA Official: Jay Norris. Specific rights apply.
A service of: EUD at NASA / GSFC
& Michigan Tech. U.")
Alt...
2005 October 21
Ringside
* Credit : Cassini Imaging Team, SSI, JPL, ESA, NASA
Explanation:
Orbiting in the plane of Saturn's rings, Dione and the other icy saturnian moons have a perpetual ringside view of the gorgeous gas giant planet. Of course, while passing through the ring plane the Cassini spacecraft also shares their stunning perspective. The rings themselves can be seen slicing across the bottom of this Cassini snapshot. Remarkably thin, the bright rings still cast arcing shadows across the planet's cloud tops. Pale Dione, in the foreground, is about 1,100 kilometers across and orbits over 300,000 kilometers from the visible outer edge of the A ring.
Authors & editors: Robert Nemiroff (MTU) & Jerry Bonnell (USRA)
NASA Web Site Statements, Warnings, and Disclaimers
NASA Official: Jay Norris. Specific rights apply.
A service of: EUD at NASA / GSFC
& Michigan Tech. U.
2015 August 24
Dione, Rings, Shadows, Saturn
* Credit : Cassini Imaging Team, SSI, JPL, ESA, NASA
http://ciclops.org/
http://www.spacescience.org/
http://www.jpl.nasa.gov/
http://www.esa.int/
http://www.nasa.gov/home/index.html
Explanation:
What's happening in this strange juxtaposition of moon and planet? First and foremost, Saturn's moon Dione was captured here in a dramatic panorama by the robotic Cassini spacecraft currently orbiting the giant planet. The bright and cratered moon itself spans about 1100-km, with the large multi-ringed crater Evander visible on the lower right. Since the rings of Saturn are seen here nearly edge-on, they are directly visible only as a thin horizontal line that passes behind Dione. Arcing across the bottom of the image, however, are shadows of Saturn's rings, showing some of the rich texture that could not be seen directly. In the background, few cloud features are visible on Saturn. The featured image was taken during the last planned flyby of Dione by Cassini, as the spacecraft is scheduled to dive into Saturn's atmosphere during 2017.
https://apod.nasa.gov/apod/ap150824.html
#space #moon #Dione #Saturn #astrophotography #photography #science #astronomy #nature #NASA
 & Jerry Bonnell (UMCP)
NASA Official: Phillip Newman Specific rights apply.
NASA Web Privacy Policy and Important Notices
A service of: ASD at NASA / GSFC
& Michigan Tech. U.")
Alt...
2015 August 24
Dione, Rings, Shadows, Saturn
* Image Credit: Cassini Imaging Team, SSI, JPL, ESA, NASA
Explanation:
What's happening in this strange juxtaposition of moon and planet? First and foremost, Saturn's moon Dione was captured here in a dramatic panorama by the robotic Cassini spacecraft currently orbiting the giant planet. The bright and cratered moon itself spans about 1100-km, with the large multi-ringed crater Evander visible on the lower right. Since the rings of Saturn are seen here nearly edge-on, they are directly visible only as a thin horizontal line that passes behind Dione. Arcing across the bottom of the image, however, are shadows of Saturn's rings, showing some of the rich texture that could not be seen directly. In the background, few cloud features are visible on Saturn. The featured image was taken during the last planned flyby of Dione by Cassini, as the spacecraft is scheduled to dive into Saturn's atmosphere during 2017.
Authors & editors: Robert Nemiroff (MTU) & Jerry Bonnell (UMCP)
NASA Official: Phillip Newman Specific rights apply.
NASA Web Privacy Policy and Important Notices
A service of: ASD at NASA / GSFC
& Michigan Tech. U.
2015 July 8
In the Company of Dione
* Image Credit: NASA/JPL-Caltech/Space Science Institute
http://www.nasa.gov/
http://www.spacescience.org/index.php
Explanation:
That is not our Moon. It's Dione, and it's a moon of Saturn. The robotic Cassini spacecraft took the featured image during a flyby of Saturn's cratered Moon last month. Perhaps what makes this image so interesting, though, is the background. First, the large orb looming behind Dione is Saturn itself, faintly lit by sunlight first reflected from the rings. Next, the thin lines running diagonally across the image are the rings of Saturn themselves. The millions of icy rocks that compose Saturn's spectacular rings all orbit Saturn in the same plane, and so appear surprisingly thin when seen nearly edge-on. Front and center, Dione appears in crescent phase, partially lit by the Sun that is off to the lower left. A careful inspection of the ring plane should also locate the moon Enceladus on the upper right.
https://apod.nasa.gov/apod/ap150708.html
#space #moon #Dione #saturn #astrophotography #photography #science #astronomy #nature #NASA
 & Jerry Bonnell (UMCP)
NASA Official: Phillip Newman Specific rights apply.
NASA Web Privacy Policy and Important Notices
A service of: ASD at NASA / GSFC
& Michigan Tech. U.")
Alt...
2015 July 8
In the Company of Dione
* Image Credit: NASA/JPL-Caltech/Space Science Institute
Explanation:
That is not our Moon. It's Dione, and it's a moon of Saturn. The robotic Cassini spacecraft took the featured image during a flyby of Saturn's cratered Moon last month. Perhaps what makes this image so interesting, though, is the background. First, the large orb looming behind Dione is Saturn itself, faintly lit by sunlight first reflected from the rings. Next, the thin lines running diagonally across the image are the rings of Saturn themselves. The millions of icy rocks that compose Saturn's spectacular rings all orbit Saturn in the same plane, and so appear surprisingly thin when seen nearly edge-on. Front and center, Dione appears in crescent phase, partially lit by the Sun that is off to the lower left. A careful inspection of the ring plane should also locate the moon Enceladus on the upper right.
Authors & editors: Robert Nemiroff (MTU) & Jerry Bonnell (UMCP)
NASA Official: Phillip Newman Specific rights apply.
NASA Web Privacy Policy and Important Notices
A service of: ASD at NASA / GSFC
& Michigan Tech. U.
2025 June 10
Enceladus in True Color
* Image Credit: NASA, ESA, JPL, SSI, Cassini Imaging Team
http://ciclops.org/
http://www.spacescience.org/
http://www.jpl.nasa.gov/
http://www.esa.int/
http://www.nasa.gov/home/index.html
Explanation:
Do oceans under the ice of Saturn's moon Enceladus contain life? A reason to think so involves long features -- some dubbed tiger stripes -- that are known to be spewing ice from the moon's icy interior into space. These surface cracks create clouds of fine ice particles over the moon's South Pole and create Saturn's mysterious E-ring. Evidence for this has come from the robot Cassini spacecraft that orbited Saturn from 2004 to 2017. Pictured here, a high resolution image of Enceladus is shown in true color from a close flyby. The deep crevasses are partly shadowed. Why Enceladus is active remains a mystery, as the neighboring moon Mimas, approximately the same size, appears quite dead. An analysis of ejected ice grains has yielded evidence that complex organic molecules exist inside Enceladus. These large carbon-rich molecules bolster -- but do not prove -- that oceans under Enceladus' surface could contain life.
https://science.nasa.gov/saturn/moons/enceladus/
https://apod.nasa.gov/apod/ap250610.html
#space #moon #Enceladus #saturn #astrophotography #photography #science #astronomy #nature #NASA
 & Jerry Bonnell (UMCP)
NASA Official: Amber Straughn Specific rights apply.
NASA Web Privacy, Accessibility, Notices;
A service of: ASD at NASA / GSFC,
NASA Science Activation
& Michigan Tech. U.")
Alt...
2025 June 10
Enceladus in True Color
* Image Credit: NASA, ESA, JPL, SSI, Cassini Imaging Team
Explanation:
Do oceans under the ice of Saturn's moon Enceladus contain life? A reason to think so involves long features -- some dubbed tiger stripes -- that are known to be spewing ice from the moon's icy interior into space. These surface cracks create clouds of fine ice particles over the moon's South Pole and create Saturn's mysterious E-ring. Evidence for this has come from the robot Cassini spacecraft that orbited Saturn from 2004 to 2017. Pictured here, a high resolution image of Enceladus is shown in true color from a close flyby. The deep crevasses are partly shadowed. Why Enceladus is active remains a mystery, as the neighboring moon Mimas, approximately the same size, appears quite dead. An analysis of ejected ice grains has yielded evidence that complex organic molecules exist inside Enceladus. These large carbon-rich molecules bolster -- but do not prove -- that oceans under Enceladus' surface could contain life.
Authors & editors: Robert Nemiroff (MTU) & Jerry Bonnell (UMCP)
NASA Official: Amber Straughn Specific rights apply.
NASA Web Privacy, Accessibility, Notices;
A service of: ASD at NASA / GSFC,
NASA Science Activation
& Michigan Tech. U.
2007 October 13
Enceladus Ice Geysers
* Credit : Cassini Imaging Team, SSI, JPL, ESA, NASA
http://ciclops.org/
http://www.spacescience.org/
http://www.jpl.nasa.gov/
http://www.esa.int/
http://www.nasa.gov/home/index.html
Explanation:
Ice geysers erupt on Enceladus, bright and shiny inner moon of Saturn. Shown in this false-color image, a backlit view of the moon's southern limb, the majestic, icy plumes were discovered by instruments on the Cassini Spacecraft during close encounters with Enceladus in November of 2005. Eight source locations for these geysers have now been identified along substantial surface fractures in the moon's south polar region. Researchers suspect the geysers arise from near-surface pockets of liquid water with temperatures near 273 kelvins (0 degrees C). That's hot when compared to the distant moon's surface temperature of 73 kelvins (-200 degrees C). The cryovolcanism is a dramatic sign that tiny, 500km-diameter Enceladus is surprisingly active. Enceladus ice geysers also likely produce Saturn's faint but extended E ring.
https://en.wikipedia.org/wiki/Enceladus
https://apod.nasa.gov/apod/ap071013.html
#space #moon #Enceladus #saturn #astrophotography #photography #science #astronomy #nature #NASA
. That's hot when compared to the distant moon's surface temperature of 73 kelvins (-200 degrees C). The cryovolcanism is a dramatic sign that tiny, 500km-diameter Enceladus is surprisingly active. Enceladus ice geysers also likely produce Saturn's faint but extended E ring.
Authors & editors: Robert Nemiroff (MTU) & Jerry Bonnell (UMCP)
NASA Official: Phillip Newman Specific rights apply.
NASA Web Privacy Policy and Important Notices
A service of: ASD at NASA / GSFC
& Michigan Tech. U.")
Alt...
2007 October 13
Enceladus Ice Geysers
* Credit: Cassini Imaging Team, SSI, JPL, ESA, NASA
Explanation:
Ice geysers erupt on Enceladus, bright and shiny inner moon of Saturn. Shown in this false-color image, a backlit view of the moon's southern limb, the majestic, icy plumes were discovered by instruments on the Cassini Spacecraft during close encounters with Enceladus in November of 2005. Eight source locations for these geysers have now been identified along substantial surface fractures in the moon's south polar region. Researchers suspect the geysers arise from near-surface pockets of liquid water with temperatures near 273 kelvins (0 degrees C). That's hot when compared to the distant moon's surface temperature of 73 kelvins (-200 degrees C). The cryovolcanism is a dramatic sign that tiny, 500km-diameter Enceladus is surprisingly active. Enceladus ice geysers also likely produce Saturn's faint but extended E ring.
Authors & editors: Robert Nemiroff (MTU) & Jerry Bonnell (UMCP)
NASA Official: Phillip Newman Specific rights apply.
NASA Web Privacy Policy and Important Notices
A service of: ASD at NASA / GSFC
& Michigan Tech. U.
2025 November 30
The Surface of Titan from Huygens
* Image Credit: ESA, NASA, JPL, U. Arizona, Huygens Lander
https://www.esa.int/
https://www.nasa.gov/
https://www.jpl.nasa.gov/
https://www.lpl.arizona.edu/research/titan-outer-solar-system
https://www.esa.int/Science_Exploration/Space_Science/Cassini-Huygens/Huygens_spacecraft
Explanation:
If you could stand on Titan -- what would you see? The featured color view from Titan gazes across an unfamiliar and distant landscape on Saturn's largest moon. The scene was recorded by ESA's Huygens probe in 2005 after a 2.5-hour descent through a thick atmosphere of nitrogen laced with methane. Bathed in an eerie orange light at ground level, rocks strewn about the scene could well be composed of water and hydrocarbons frozen solid at an inhospitable temperature of negative 179 degrees C. The large light-toned rock below and left of center is only about 15 centimeters across and lies 85 centimeters away. The saucer-shaped spacecraft is believed to have penetrated about 15 centimeters into a place on Titan's surface that had the consistency of wet sand or clay. Huygen's batteries enabled the probe to take and transmit data for more than 90 minutes after landing. Titan's bizarre chemical environment may bear similarities to planet Earth's before life evolved.
https://www.esa.int/Science_Exploration/Space_Science/Cassini-Huygens/New_images_from_Titan#subhead2
https://en.wikipedia.org/wiki/Titan_(moon)
https://www.esa.int/
https://science.nasa.gov/mission/cassini-huygens/
https://apod.nasa.gov/apod/ap250119.html
https://www.jpl.nasa.gov/news/titans-surface-organics-surpass-oil-reserves-on-earth/
https://science.nasa.gov/mission/cassini-huygens/
https://www.esa.int/Science_Exploration/Space_Science/Cassini-Huygens/Life_on_Titan
https://apod.nasa.gov/apod/ap251129.html
#space #saturn #astrophotography #photography #science #astronomy #physics #nature #NASA #ESA #education #apod
 & Jerry Bonnell (UMCP)
NASA Official: Amber Straughn Specific rights apply.")
Alt...
2025 November 30
A strange orange landscape is shown. What appears to be light and dark orange rocks are strewn about. The landscape appears roughly flat all the way out to the orange sky and horizon.
The Surface of Titan from Huygens
* Image Credit: ESA, NASA, JPL, U. Arizona, Huygens Lander
Explanation:
If you could stand on Titan -- what would you see? The featured color view from Titan gazes across an unfamiliar and distant landscape on Saturn's largest moon. The scene was recorded by ESA's Huygens probe in 2005 after a 2.5-hour descent through a thick atmosphere of nitrogen laced with methane. Bathed in an eerie orange light at ground level, rocks strewn about the scene could well be composed of water and hydrocarbons frozen solid at an inhospitable temperature of negative 179 degrees C. The large light-toned rock below and left of center is only about 15 centimeters across and lies 85 centimeters away. The saucer-shaped spacecraft is believed to have penetrated about 15 centimeters into a place on Titan's surface that had the consistency of wet sand or clay. Huygen's batteries enabled the probe to take and transmit data for more than 90 minutes after landing. Titan's bizarre chemical environment may bear similarities to planet Earth's before life evolved.
Authors & editors: Robert Nemiroff (MTU) & Jerry Bonnell (UMCP)
NASA Official: Amber Straughn Specific rights apply.

![[?]](https://media.universeodon.com/accounts/avatars/109/501/736/783/125/826/original/387a622be46bcde9.png)

From Orion to the Southern Cross
Credits: Lucy Yunxi Hu
#nature #space #astrophotography

Alt...
From Orion to the Southern Cross
2025 November 29
Moon Games
* Image Credit & Copyright: Giorgia Hofer
https://www.giorgiahoferphotography.com/
Explanation:
This is not a screen from a video game. Nestled below the tree-line, the small mountain church does look like it might be hiding from Moon though. In the well-composed telephoto snapshot, taken on November 23, the church walls are partly reflecting light from terrestrial flood lights. Of course, the Moon is reflecting light from the Sun. At any given time the Sun illuminates fully half of the Moon's surface, also known as the lunar dayside, but on that night only a sliver of its sunlit surface was visible. About three days after New Moon, the Moon was in a waxing crescent phase. The single exposure was captured shortly after sunset in skies near Danta di Cadore, northern Italy, planet Earth.
https://www.giorgiahoferphotography.com/moon
https://moon.nasa.gov/moon-observation/daily-moon-guide/?intent=021
https://science.nasa.gov/moon/moon-phases/
https://apod.nasa.gov/apod/fap/ap251129.html
#space #moon #apod #NASA #astrophotography #photography #science #astronomy #nature #space_related #Space_Culture_Club
 & Jerry Bonnell (UMCP)
NASA Official: Amber Straughn Specific rights apply.
NASA Web Privacy, Accessibility, Notices;
A service of: ASD at NASA / GSFC,
NASA Science Activation
& Michigan Tech. U.")
Alt...
2025 November 29
Moon Games
* Image Credit & Copyright: Giorgia Hofer
Explanation:
This is not a screen from a video game. Nestled below the tree-line, the small mountain church does look like it might be hiding from Moon though. In the well-composed telephoto snapshot, taken on November 23, the church walls are partly reflecting light from terrestrial flood lights. Of course, the Moon is reflecting light from the Sun. At any given time the Sun illuminates fully half of the Moon's surface, also known as the lunar dayside, but on that night only a sliver of its sunlit surface was visible. About three days after New Moon, the Moon was in a waxing crescent phase. The single exposure was captured shortly after sunset in skies near Danta di Cadore, northern Italy, planet Earth.
Authors & editors: Robert Nemiroff (MTU) & Jerry Bonnell (UMCP)
NASA Official: Amber Straughn Specific rights apply.
NASA Web Privacy, Accessibility, Notices;
A service of: ASD at NASA / GSFC,
NASA Science Activation
& Michigan Tech. U.
2006 March 24
When Roses Aren't Red
* Credit & Copyright: Jay Ballauer (All About Astro, 3RF)
Explanation:
Not all roses are red of course, but they can still be very pretty. Likewise, the beautiful Rosette Nebula and other star forming regions are often shown in astronomical images with a predominately red hue - in part because the dominant emission in the nebula is from hydrogen atoms. Hydrogen's strongest optical emission line, known as H-alpha, is in the red region of the spectrum, but the beauty of an emission nebula need not be appreciated in red light alone. Other atoms in the nebula are also excited by energetic starlight and produce narrow emission lines as well. In this gorgeous view of the Rosette's central regions, narrow band images are combined to show emission from sulfur atoms in red, hydrogen in blue, and oxygen in green. In fact, the scheme of mapping these narrow atomic emission lines into broader colors is adopted in many Hubble images of stellar nurseries. This image spans about 50 light-years in the constellation Monoceros, at the 3,000 light-year estimated distance of the Rosette Nebula.
https://apod.nasa.gov/apod/ap060324.html
#space #nebula #astrophotography #photography #science #astronomy #physics #nature #NASA #ESA

Explanation:
Not all roses are red of course, but they can still be very pretty. Likewise, the beautiful Rosette Nebula and other star forming regions are often shown in astronomical images with a predominately red hue - in part because the dominant emission in the nebula is from hydrogen atoms. Hydrogen's strongest optical emission line, known as H-alpha, is in the red region of the spectrum, but the beauty of an emission nebula need not be appreciated in red light alone. Other atoms in the nebula are also excited by energetic starlight and produce narrow emission lines as well. In this gorgeous view of the Rosette's central regions, narrow band images are combined to show emission from sulfur atoms in red, hydrogen in blue, and oxygen in green. In fact, the scheme of mapping these narrow atomic emission lines into broader colors is adopted in many Hubble images of stellar nurseries. This image spans about 50 light-years in the constellation Monoceros, at the 3,000 light-year estimated distance of the Rosette Nebula.
Authors & editors: Robert Nemiroff (MTU) & Jerry Bonnell (USRA)
NASA Web Site Statements, Warnings, and Disclaimers
NASA Official: Jay Norris. Specific rights apply.
A service of: EUD at NASA / GSFC
& Michigan Tech. U.")
Alt...
2006 March 24
When Roses Aren't Red
* Credit & Copyright: Jay Ballauer (All About Astro, 3RF)
Explanation:
Not all roses are red of course, but they can still be very pretty. Likewise, the beautiful Rosette Nebula and other star forming regions are often shown in astronomical images with a predominately red hue - in part because the dominant emission in the nebula is from hydrogen atoms. Hydrogen's strongest optical emission line, known as H-alpha, is in the red region of the spectrum, but the beauty of an emission nebula need not be appreciated in red light alone. Other atoms in the nebula are also excited by energetic starlight and produce narrow emission lines as well. In this gorgeous view of the Rosette's central regions, narrow band images are combined to show emission from sulfur atoms in red, hydrogen in blue, and oxygen in green. In fact, the scheme of mapping these narrow atomic emission lines into broader colors is adopted in many Hubble images of stellar nurseries. This image spans about 50 light-years in the constellation Monoceros, at the 3,000 light-year estimated distance of the Rosette Nebula.
Authors & editors: Robert Nemiroff (MTU) & Jerry Bonnell (USRA)
NASA Web Site Statements, Warnings, and Disclaimers
NASA Official: Jay Norris. Specific rights apply.
A service of: EUD at NASA / GSFC
& Michigan Tech. U.
2015 January 13
The Soap Bubble Nebula
* Credit & Copyright: T. Rector (U. Alaska Anchorage), H. Schweiker (WIYN), NOAO, AURA, NSF
https://www.aura-astronomy.org/
https://www.nsf.gov/
Explanation:
Adrift in the rich star fields of the constellation Cygnus, this lovely, symmetric nebula was only recognized a few years ago and does not yet appear in some astronomical catalogs. In fact, amateur astronomer Dave Jurasevich identified it as a nebula on 2008 July 6 in his images of the complex Cygnus region that included the Crescent Nebula (NGC 6888). He subsequently notified the International Astronomical Union. Only eleven days later the same object was independently identified by Mel Helm at Sierra Remote Observatories, imaged by Keith Quattrocchi and Helm, and also submitted to the IAU as a potentially unknown nebula. The nebula, appearing on the left of the featured image, is now known as the Soap Bubble Nebula. What is the newly recognized nebula? Most probably it is a planetary nebula, a final phase in the life of a sun-like star.
https://apod.nasa.gov/apod/ap150113.html
#space #nebula #astrophotography #photography #science #astronomy #physics #nature #NASA #ESA
, H. Schweiker (WIYN), NOAO, AURA, NSF
Explanation:
Adrift in the rich star fields of the constellation Cygnus, this lovely, symmetric nebula was only recognized a few years ago and does not yet appear in some astronomical catalogs. In fact, amateur astronomer Dave Jurasevich identified it as a nebula on 2008 July 6 in his images of the complex Cygnus region that included the Crescent Nebula (NGC 6888). He subsequently notified the International Astronomical Union. Only eleven days later the same object was independently identified by Mel Helm at Sierra Remote Observatories, imaged by Keith Quattrocchi and Helm, and also submitted to the IAU as a potentially unknown nebula. The nebula, appearing on the left of the featured image, is now known as the Soap Bubble Nebula. What is the newly recognized nebula? Most probably it is a planetary nebula, a final phase in the life of a sun-like star.
Authors & editors: Robert Nemiroff (MTU) & Jerry Bonnell (UMCP)
NASA Official: Phillip Newman Specific rights apply.
NASA Web Privacy Policy and Important Notices
A service of: ASD at NASA / GSFC
& Michigan Tech. U.")
Alt...
2015 January 13
The Soap Bubble Nebula
* Credit & Copyright: T. Rector (U. Alaska Anchorage), H. Schweiker (WIYN), NOAO, AURA, NSF
Explanation:
Adrift in the rich star fields of the constellation Cygnus, this lovely, symmetric nebula was only recognized a few years ago and does not yet appear in some astronomical catalogs. In fact, amateur astronomer Dave Jurasevich identified it as a nebula on 2008 July 6 in his images of the complex Cygnus region that included the Crescent Nebula (NGC 6888). He subsequently notified the International Astronomical Union. Only eleven days later the same object was independently identified by Mel Helm at Sierra Remote Observatories, imaged by Keith Quattrocchi and Helm, and also submitted to the IAU as a potentially unknown nebula. The nebula, appearing on the left of the featured image, is now known as the Soap Bubble Nebula. What is the newly recognized nebula? Most probably it is a planetary nebula, a final phase in the life of a sun-like star.
Authors & editors: Robert Nemiroff (MTU) & Jerry Bonnell (UMCP)
NASA Official: Phillip Newman Specific rights apply.
NASA Web Privacy Policy and Important Notices
A service of: ASD at NASA / GSFC
& Michigan Tech. U.
2015 December 4
Cygnus: Bubble and Crescent
* Image Credit & Copyright: Ivan Eder
https://www.astroeder.com/
Explanation:
These clouds of gas and dust drift through rich star fields along the plane of our Milky Way Galaxy toward the high flying constellation Cygnus. Caught within the telescopic field of view are the Soap Bubble (lower left) and the Crescent Nebula (upper right). Both were formed at a final phase in the life of a star. Also known as NGC 6888, the Crescent was shaped as its bright, central massive Wolf-Rayet star, WR 136, shed its outer envelope in a strong stellar wind. Burning through fuel at a prodigious rate, WR 136 is near the end of a short life that should finish in a spectacular supernova explosion. recently discovered Soap Bubble Nebula is likely a planetary nebula, the final shroud of a lower mass, long-lived, sun-like star destined to become a slowly cooling white dwarf. While both are some 5,000 light-years or so distant, the larger Crescent Nebula is around 25 light-years across.
https://www.astroeder.com/ngc6888_bub_eder_en.html
https://apod.nasa.gov/apod/ap151204.html
#space #nebula #astrophotography #photography #science #astronomy #physics #nature #NASA #ESA
 and the Crescent Nebula (upper right). Both were formed at a final phase in the life of a star. Also known as NGC 6888, the Crescent was shaped as its bright, central massive Wolf-Rayet star, WR 136, shed its outer envelope in a strong stellar wind. Burning through fuel at a prodigious rate, WR 136 is near the end of a short life that should finish in a spectacular supernova explosion. recently discovered Soap Bubble Nebula is likely a planetary nebula, the final shroud of a lower mass, long-lived, sun-like star destined to become a slowly cooling white dwarf. While both are some 5,000 light-years or so distant, the larger Crescent Nebula is around 25 light-years across.
Authors & editors: Robert Nemiroff (MTU) & Jerry Bonnell (UMCP)
NASA Official: Amber Straughn Specific rights apply.
NASA Web Privacy, Accessibility, Notices;
A service of: ASD at NASA / GSFC,
NASA Science Activation
& Michigan Tech. U.")
Alt...
2015 December 4
Cygnus: Bubble and Crescent
* Image Credit & Copyright: Ivan Eder
Explanation:
These clouds of gas and dust drift through rich star fields along the plane of our Milky Way Galaxy toward the high flying constellation Cygnus. Caught within the telescopic field of view are the Soap Bubble (lower left) and the Crescent Nebula (upper right). Both were formed at a final phase in the life of a star. Also known as NGC 6888, the Crescent was shaped as its bright, central massive Wolf-Rayet star, WR 136, shed its outer envelope in a strong stellar wind. Burning through fuel at a prodigious rate, WR 136 is near the end of a short life that should finish in a spectacular supernova explosion. recently discovered Soap Bubble Nebula is likely a planetary nebula, the final shroud of a lower mass, long-lived, sun-like star destined to become a slowly cooling white dwarf. While both are some 5,000 light-years or so distant, the larger Crescent Nebula is around 25 light-years across.
Authors & editors: Robert Nemiroff (MTU) & Jerry Bonnell (UMCP)
NASA Official: Amber Straughn Specific rights apply.
NASA Web Privacy, Accessibility, Notices;
A service of: ASD at NASA / GSFC,
NASA Science Activation
& Michigan Tech. U.
2012 August 16
NGC 6888: The Crescent Nebula
* Image Credit & Copyright: J-P Metsävainio (Astro Anarchy)
https://astroanarchy.blogspot.com/
Explanation:
NGC 6888, also known as the Crescent Nebula, is a cosmic bubble about 25 light-years across, blown by winds from its central, bright, massive star. This colorful portrait of the nebula uses narrow band image data combined in the Hubble palette. It shows emission from sulfur, hydrogen, and oxygen atoms in the wind-blown nebula in red, green and blue hues. NGC 6888's central star is classified as a Wolf-Rayet star (WR 136). The star is shedding its outer envelope in a strong stellar wind, ejecting the equivalent of the Sun's mass every 10,000 years. The nebula's complex structures are likely the result of this strong wind interacting with material ejected in an earlier phase. Burning fuel at a prodigious rate and near the end of its stellar life this star should ultimately go out with a bang in a spectacular supernova explosion. Found in the nebula rich constellation Cygnus, NGC 6888 is about 5,000 light-years away.
https://astroanarchy.blogspot.com/2011/01/ngc-6888-crescent-nebula-reprocessed.html
http://hubblesite.org/gallery/behind_the_pictures/meaning_of_color/eagle.php
https://apod.nasa.gov/apod/ap080424.html
https://apod.nasa.gov/apod/ap060430.html
https://apod.nasa.gov/apod/ap120816.html
#space #nebula #astrophotography #photography #science #astronomy #physics #nature #NASA #ESA

Explanation:
NGC 6888, also known as the Crescent Nebula, is a cosmic bubble about 25 light-years across, blown by winds from its central, bright, massive star. This colorful portrait of the nebula uses narrow band image data combined in the Hubble palette. It shows emission from sulfur, hydrogen, and oxygen atoms in the wind-blown nebula in red, green and blue hues. NGC 6888's central star is classified as a Wolf-Rayet star (WR 136). The star is shedding its outer envelope in a strong stellar wind, ejecting the equivalent of the Sun's mass every 10,000 years. The nebula's complex structures are likely the result of this strong wind interacting with material ejected in an earlier phase. Burning fuel at a prodigious rate and near the end of its stellar life this star should ultimately go out with a bang in a spectacular supernova explosion. Found in the nebula rich constellation Cygnus, NGC 6888 is about 5,000 light-years away.
Authors & editors: Robert Nemiroff (MTU) & Jerry Bonnell (UMCP)
NASA Official: Phillip Newman Specific rights apply.
NASA Web Privacy Policy and Important Notices
A service of: ASD at NASA / GSFC
& Michigan Tech. U.")
Alt...
2012 August 16
NGC 6888: The Crescent Nebula
* Image Credit & Copyright: J-P Metsävainio (Astro Anarchy)
Explanation:
NGC 6888, also known as the Crescent Nebula, is a cosmic bubble about 25 light-years across, blown by winds from its central, bright, massive star. This colorful portrait of the nebula uses narrow band image data combined in the Hubble palette. It shows emission from sulfur, hydrogen, and oxygen atoms in the wind-blown nebula in red, green and blue hues. NGC 6888's central star is classified as a Wolf-Rayet star (WR 136). The star is shedding its outer envelope in a strong stellar wind, ejecting the equivalent of the Sun's mass every 10,000 years. The nebula's complex structures are likely the result of this strong wind interacting with material ejected in an earlier phase. Burning fuel at a prodigious rate and near the end of its stellar life this star should ultimately go out with a bang in a spectacular supernova explosion. Found in the nebula rich constellation Cygnus, NGC 6888 is about 5,000 light-years away.
Authors & editors: Robert Nemiroff (MTU) & Jerry Bonnell (UMCP)
NASA Official: Phillip Newman Specific rights apply.
NASA Web Privacy Policy and Important Notices
A service of: ASD at NASA / GSFC
& Michigan Tech. U.
2025 November 28
NGC 6888: The Crescent Nebula
* Image Credit & Copyright: Greg Bass
https://app.astrobin.com/u/1loosetooth#gallery
Explanation:
NGC 6888, also known as the Crescent Nebula, is a about 25 light-years across, a cosmic bubble blown by winds from its central, massive star. This deep telescopic image includes narrowband image data, to isolate light from hydrogen and oxygen atoms. The oxygen atoms produce the blue-green hue that seems to enshroud the nebula's detailed folds and filaments. Visible within the nebula, NGC 6888's central star is classified as a Wolf-Rayet star (WR 136). The star is shedding its outer envelope in a strong stellar wind, ejecting the equivalent of the Sun's mass every 10,000 years. In fact, the Crescent Nebula's complex structures are likely the result of this strong wind interacting with material ejected in an earlier phase. Burning fuel at a prodigious rate and near the end of its stellar life, this star should ultimately go out with a bang in a spectacular supernova explosion. Found in the nebula rich constellation Cygnus, NGC 6888 is about 5,000 light-years away.
https://app.astrobin.com/i/8p42ig
https://science.nasa.gov/missions/hubble/hubble-watches-star-tear-apart-its-neighborhood/
http://cfa-www.harvard.edu/~pberlind/atlas/htmls/wrstars.html
https://oneminuteastronomer.com/5995/crescent-nebula-ngc-6888/
http://chandra.harvard.edu/photo/2003/ngc6888/
https://en.wikipedia.org/wiki/Wolf%E2%80%93Rayet_star#Supernovae
https://en.wikipedia.org/wiki/Stellar_wind
https://apod.nasa.gov/apod/fap/ap251128.html
#space #nebula #astrophotography #photography #science #astronomy #physics #nature #NASA #ESA #apod
. The star is shedding its outer envelope in a strong stellar wind, ejecting the equivalent of the Sun's mass every 10,000 years. In fact, the Crescent Nebula's complex structures are likely the result of this strong wind interacting with material ejected in an earlier phase. Burning fuel at a prodigious rate and near the end of its stellar life, this star should ultimately go out with a bang in a spectacular supernova explosion. Found in the nebula rich constellation Cygnus, NGC 6888 is about 5,000 light-years away.
Authors & editors: Robert Nemiroff (MTU) & Jerry Bonnell (UMCP)
NASA Official: Amber Straughn Specific rights apply.
NASA Web Privacy, Accessibility, Notices;
A service of: ASD at NASA / GSFC,
NASA Science Activation
& Michigan Tech. U.")
Alt...
2025 November 28
NGC 6888: The Crescent Nebula
* Image Credit & Copyright: Greg Bass
Explanation:
NGC 6888, also known as the Crescent Nebula, is a about 25 light-years across, a cosmic bubble blown by winds from its central, massive star. This deep telescopic image includes narrowband image data, to isolate light from hydrogen and oxygen atoms. The oxygen atoms produce the blue-green hue that seems to enshroud the nebula's detailed folds and filaments. Visible within the nebula, NGC 6888's central star is classified as a Wolf-Rayet star (WR 136). The star is shedding its outer envelope in a strong stellar wind, ejecting the equivalent of the Sun's mass every 10,000 years. In fact, the Crescent Nebula's complex structures are likely the result of this strong wind interacting with material ejected in an earlier phase. Burning fuel at a prodigious rate and near the end of its stellar life, this star should ultimately go out with a bang in a spectacular supernova explosion. Found in the nebula rich constellation Cygnus, NGC 6888 is about 5,000 light-years away.
Authors & editors: Robert Nemiroff (MTU) & Jerry Bonnell (UMCP)
NASA Official: Amber Straughn Specific rights apply.
NASA Web Privacy, Accessibility, Notices;
A service of: ASD at NASA / GSFC,
NASA Science Activation
& Michigan Tech. U.
2016 September 9
The Wide and Deep Lagoon
* Image Credit & Copyright: Michael Miller, Jimmy Walker
http://www.remarkableheavens.com/
https://www.darkskywalker.com/
Explanation:
Ridges of glowing interstellar gas and dark dust clouds inhabit the turbulent, cosmic depths of the Lagoon Nebula. Also known as M8, the bright star forming region is about 5,000 light-years distant. But it still makes for a popular stop on telescopic tours of the constellation Sagittarius, toward the center of our Milky Way Galaxy. Dominated by the telltale red emission of ionized hydrogen atoms recombining with stripped electrons, this stunning, deep view of the Lagoon is nearly 100 light-years across. Right of center, the bright, compact, hourglass shape is gas ionized and sculpted by energetic radiation and extreme stellar winds from a massive young star. In fact, the many bright stars of open cluster NGC 6530 drift within the nebula, just formed in the Lagoon several million years ago.
https://science.nasa.gov/mission/hubble/
https://apod.nasa.gov/apod/ap141125.html
https://apod.nasa.gov/apod/ap140820.html
https://arxiv.org/abs/1311.1201
https://arxiv.org/abs/1209.0898
https://apod.nasa.gov/apod/ap160909.html
#space #nebula #astrophotography #photography #science #astronomy #nature #NASA #ESA
 & Jerry Bonnell (UMCP)
NASA Official: Phillip Newman Specific rights apply.
NASA Web Privacy Policy and Important Notices
A service of: ASD at NASA / GSFC")
Alt...
2016 September 9
The Wide and Deep Lagoon
* Image Credit & Copyright: Michael Miller, Jimmy Walker
Explanation:
Ridges of glowing interstellar gas and dark dust clouds inhabit the turbulent, cosmic depths of the Lagoon Nebula. Also known as M8, the bright star forming region is about 5,000 light-years distant. But it still makes for a popular stop on telescopic tours of the constellation Sagittarius, toward the center of our Milky Way Galaxy. Dominated by the telltale red emission of ionized hydrogen atoms recombining with stripped electrons, this stunning, deep view of the Lagoon is nearly 100 light-years across. Right of center, the bright, compact, hourglass shape is gas ionized and sculpted by energetic radiation and extreme stellar winds from a massive young star. In fact, the many bright stars of open cluster NGC 6530 drift within the nebula, just formed in the Lagoon several million years ago.
Authors & editors: Robert Nemiroff (MTU) & Jerry Bonnell (UMCP)
NASA Official: Phillip Newman Specific rights apply.
NASA Web Privacy Policy and Important Notices
A service of: ASD at NASA / GSFC
2025 November 27
Portrait of NGC 1055
* Image Credit & Copyright: John Hayes
https://app.astrobin.com/u/jhayes_tucson#gallery
Explanation:
Big, beautiful spiral galaxy NGC 1055 is a dominant member of a small galaxy group a mere 60 million light-years away toward the aquatically intimidating constellation Cetus. Seen edge-on, the island universe spans over 100,000 light-years, a little larger than our own Milky Way galaxy. The colorful, spiky stars decorating this cosmic portrait of NGC 1055 are in the foreground, well within the Milky Way. But telltale pinkish star forming regions and young blue star clusters are scattered through winding dust lanes along the distant galaxy's thin disk. With a smattering of even more distant background galaxies, the deep image also reveals a boxy halo that extends far above and below the central bulge and disk of NGC 1055. The halo itself is laced with faint, narrow structures, and could represent the mixed and spread out debris from a satellite galaxy disrupted by the larger spiral some 10 billion years ago.
https://app.astrobin.com/u/jhayes_tucson?i=dt9htu#gallery
https://apod.nasa.gov/apod/ap080619.html
https://apod.nasa.gov/apod/ap061215.html
https://arxiv.org/abs/1003.4860
https://www.cosmotography.com/images/cosmological_modeling_overview.html
https://www.nasa.gov/image-article/milky-way-our-location/
https://apod.nasa.gov/apod/ap251127.html
#space #galaxy #astrophotography #photography #science #nature #NASA #ESA #apod
 & Jerry Bonnell (UMCP)
NASA Official: Amber Straughn Specific rights apply.
NASA Web Privacy, Accessibility, Notices;
A service of: ASD at NASA / GSFC,
NASA Science Activation
& Michigan Tech. U.")
Alt...
2025 November 27
Portrait of NGC 1055
* Image Credit & Copyright: John Hayes
Explanation:
Big, beautiful spiral galaxy NGC 1055 is a dominant member of a small galaxy group a mere 60 million light-years away toward the aquatically intimidating constellation Cetus. Seen edge-on, the island universe spans over 100,000 light-years, a little larger than our own Milky Way galaxy. The colorful, spiky stars decorating this cosmic portrait of NGC 1055 are in the foreground, well within the Milky Way. But telltale pinkish star forming regions and young blue star clusters are scattered through winding dust lanes along the distant galaxy's thin disk. With a smattering of even more distant background galaxies, the deep image also reveals a boxy halo that extends far above and below the central bulge and disk of NGC 1055. The halo itself is laced with faint, narrow structures, and could represent the mixed and spread out debris from a satellite galaxy disrupted by the larger spiral some 10 billion years ago.
Authors & editors: Robert Nemiroff (MTU) & Jerry Bonnell (UMCP)
NASA Official: Amber Straughn Specific rights apply.
NASA Web Privacy, Accessibility, Notices;
A service of: ASD at NASA / GSFC,
NASA Science Activation
& Michigan Tech. U.
TOPIC>
On The Edge
Gaia Reconstructs a Side View of our Galaxy
* Illustration Credit: ESA, Gaia, DPAC, Stefan Payne-Wardenaar
https://bsky.app/profile/stefanpw.bsky.social
https://www.cosmos.esa.int/web/gaia/dpac
https://www.esa.int/Science_Exploration/Space_Science/Gaia
https://www.esa.int/
https://creativecommons.org/licenses/by-sa/3.0/igo/
Explanation:
What does our Milky Way Galaxy look like from the side? Because we are on the inside, humanity can’t get an actual picture. Recently, however, just such a map has been made using location data for over a billion stars from ESA’s Gaia mission. The resulting featured illustration shows that just like many other spiral galaxies, our Milky Way has a very thin central disk. Our Sun and all the stars we see at night are in this disk. Although hypothesized before, perhaps more surprising is that the disk appears curved at the outer edges. The colors of our Galaxy's warped central band derive mostly from dark dust, bright blue stars, and red emission nebulas. Although data analysis is ongoing, Gaia was deactivated in March after a successful mission.
https://www.esa.int/Enabling_Support/Operations/Farewell_Gaia!_Spacecraft_operations_come_to_an_end
https://www.esa.int/ESA_Multimedia/Images/2013/12/Gaia_mapping_the_stars_of_the_Milky_Way
https://en.wikipedia.org/wiki/Gaia_(spacecraft)
https://science.nasa.gov/resource/the-milky-way-galaxy/
https://www.esa.int/ESA_Multimedia/Images/2025/01/The_best_Milky_Way_map_by_Gaia_edge-on
https://www.science.org/content/article/milky-way-more-warped-astronomers-thought
https://www.sci.news/astronomy/gaia-milky-way-map-13587.html
https://apod.nasa.gov/apod/ap250512.html
#space #galaxy #milkyway #astrophotography #photography #science #nature #ESA #GAIA #NASA
 & Jerry Bonnell (UMCP)
NASA Official: Amber Straughn Specific rights apply.
NASA Web Privacy, Accessibility, Notices;
A service of: ASD at NASA / GSFC,
NASA Science Activation
& Michigan Tech. U.")
Alt...
2025 May 12
A dark field of space surrounds a thin but colorful band horizontally across the center. The band is nearly straight but curves at its outer edges. Please see the explanation for more detailed information.
Gaia Reconstructs a Side View of our Galaxy
* Illustration Credit: ESA, Gaia, DPAC, Stefan Payne-Wardenaar
Explanation:
What does our Milky Way Galaxy look like from the side? Because we are on the inside, humanity can’t get an actual picture. Recently, however, just such a map has been made using location data for over a billion stars from ESA’s Gaia mission. The resulting featured illustration shows that just like many other spiral galaxies, our Milky Way has a very thin central disk. Our Sun and all the stars we see at night are in this disk. Although hypothesized before, perhaps more surprising is that the disk appears curved at the outer edges. The colors of our Galaxy's warped central band derive mostly from dark dust, bright blue stars, and red emission nebulas. Although data analysis is ongoing, Gaia was deactivated in March after a successful mission.
Authors & editors: Robert Nemiroff (MTU) & Jerry Bonnell (UMCP)
NASA Official: Amber Straughn Specific rights apply.
NASA Web Privacy, Accessibility, Notices;
A service of: ASD at NASA / GSFC,
NASA Science Activation
& Michigan Tech. U.

2025 November 26
Globular Cluster M15 Deep Field
* Image Credit & Copyright: Alvaro Ibanez Perez
https://aipastroimaging.com/sobre-mi/
Explanation:
Stars, like bees, swarm around the center of bright globular cluster M15. The central ball of over 100,000 stars is a relic from the early years of our Galaxy, and continues to orbit the Milky Way's center. M15, one of about 150 globular clusters remaining, is noted for being easily visible with only binoculars, having at its center one of the densest concentrations of stars known, and containing a high abundance of variable stars and pulsars. The featured image of M15 was taken by combining very long exposures -- 122 hours in all -- and so brings up faint wisps of gas and dust in front of the giant ball of stars. M15 lies about 35,000 light years away toward the constellation of the Winged Horse (Pegasus).
https://science.nasa.gov/universe/stars/
https://apod.nasa.gov/apod/ap980719.html
https://science.nasa.gov/resource/the-milky-way-galaxy/
https://apod.nasa.gov/apod/ap241124.html
https://www.youtube.com/watch?v=hmN7Rj2ns3M
https://en.wikipedia.org/wiki/Globular_cluster
https://apod.nasa.gov/apod/ap000804.html
https://apod.nasa.gov/apod/ap070415.html
https://svs.gsfc.nasa.gov/10144
https://en.wikipedia.org/wiki/Integrated_Flux_Nebula
https://apod.nasa.gov/apod/ap190328.html
https://spaceplace.nasa.gov/constellations/en/
https://en.wikipedia.org/wiki/Pegasus_(constellation)
https://apod.nasa.gov/apod/ap251126.html
#space #cluster #astrophotography #photography #science #astronomy #physics #nature #NASA #apod
.
Authors & editors: Robert Nemiroff (MTU) & Jerry Bonnell (UMCP)
NASA Official: Amber Straughn Specific rights apply.
NASA Web Privacy, Accessibility, Notices;
A service of: ASD at NASA / GSFC,
NASA Science Activation
& Michigan Tech. U.")
Alt...
2025 November 26
A starfield is shown with thin wisps of gray and red running through it. In the center is an usual ball -- which is a globular cluster of stars upon closer inspection.
Globular Cluster M15 Deep Field
* Image Credit & Copyright: Alvaro Ibanez Perez
Explanation:
Stars, like bees, swarm around the center of bright globular cluster M15. The central ball of over 100,000 stars is a relic from the early years of our Galaxy, and continues to orbit the Milky Way's center. M15, one of about 150 globular clusters remaining, is noted for being easily visible with only binoculars, having at its center one of the densest concentrations of stars known, and containing a high abundance of variable stars and pulsars. The featured image of M15 was taken by combining very long exposures -- 122 hours in all -- and so brings up faint wisps of gas and dust in front of the giant ball of stars. M15 lies about 35,000 light years away toward the constellation of the Winged Horse (Pegasus).
Authors & editors: Robert Nemiroff (MTU) & Jerry Bonnell (UMCP)
NASA Official: Amber Straughn Specific rights apply.
NASA Web Privacy, Accessibility, Notices;
A service of: ASD at NASA / GSFC,
NASA Science Activation
& Michigan Tech. U.
RE: https://defcon.social/@grobi/114848357974798799
.. feel free to contribute:
When will we discover that the nature of dark matter and the application of gravitational lensing allow us to look far into the past as well as far into the future? What pre-existing prerequisites for this have we overlooked and what would we have to recognize beforehand so that we do not overlook them? Why could this be important? Anyone who sees the future gets the chance to influence it positively ..
This is the ancient, present, and ultimately future hope of truly human science ..
TOPIC>
Gravitational Lensing:
https://defcon.social/@grobi/114374350096488478
https://journals.aps.org/prd/abstract/10.1103/6h6r-46cd
https://premierscience.com/pjs-25-872/
https://arxiv.org/pdf/2511.15797
https://arxiv.org/pdf/2502.04472
#space #gravitational_lensing #astrophotography #photography #science #physics #future #nature #NASA #ESA
When will we discover that the nature of dark matter and the application of gravitational lensing allow us to look far into the past as well as far into the future? What pre-existing prerequisites for this have we overlooked and what would we have to recognize beforehand so that we do not overlook them? Why could this be important? Anyone who sees the future gets the chance to influence it positively ..
This is the ancient, present, and ultimately future hope of truly human science ..https://journals.aps.org/prd/abstract/10.1103/6h6r-46cd
https://premierscience.com/pjs-25-872/
https://arxiv.org/pdf/2511.15797
https://arxiv.org/pdf/2502.04472#space #gravitational_lensing #astrophotography #photography #science #physics #future #nature #NASA #ESA
Eclipsed Moonlight
Credits: Catching the Light
#nature #space #astrophotography

Alt...
Eclipsed Moonlight
2025 November 25
Comet Lemmon and the Milky Way
* Image Credit & Copyright: Lin Zixuan (Tsinghua U.)
https://www.tsinghua.edu.cn/en/
Explanation:
What did Comet Lemmon look like when it was at its best? One example is pictured here, featuring three celestial spectacles all at different distances. The closest spectacle is the snowcapped Meili Mountains, part of the Himalayas in China. The middle marvel is Comet Lemmon near its picturesque best early this month, showing not only a white dust tail trailing off to the right but its blue solar wind-distorted ion tail trailing off to the left. Far in the distance on the left is the magnificent central plane of our Milky Way Galaxy, featuring dark dust, red nebula, and including billions of Sun-like stars. Comet C/2025 A6 (Lemmon) is already fading as it heads back into the outer Solar System, while the Himalayan mountains will gradually erode over the next billion years. The Milky Way Galaxy, though, will live on -- forming new mountains and comets -- for many billions of years into the future.
https://www.youtube.com/watch?v=YylNkfmGNAQ
https://en.wikipedia.org/wiki/Himalayas
https://apod.nasa.gov/apod/ap251117.html
https://astronomy.swin.edu.au/cosmos/C/cometary+dust+tail
https://apod.nasa.gov/apod/ap240326.html
https://science.nasa.gov/resource/the-milky-way-galaxy/
https://apod.nasa.gov/apod/ap051004.html
https://apod.nasa.gov/apod/ap240214.html
https://science.nasa.gov/sun/
https://en.wikipedia.org/wiki/C/2025_A6_(Lemmon)
https://www.pbs.org/wgbh/nova/everest/earth/birth.html
https://apod.nasa.gov/apod/ap241105.html
https://apod.nasa.gov/apod/ap210303.html
https://apod.nasa.gov/apod/ap251125.html
#space #comets #astrophotography #photography #science #astronomy #nature #NASA #ESA #education #apod

Explanation:
What did Comet Lemmon look like when it was at its best? One example is pictured here, featuring three celestial spectacles all at different distances. The closest spectacle is the snowcapped Meili Mountains, part of the Himalayas in China. The middle marvel is Comet Lemmon near its picturesque best early this month, showing not only a white dust tail trailing off to the right but its blue solar wind-distorted ion tail trailing off to the left. Far in the distance on the left is the magnificent central plane of our Milky Way Galaxy, featuring dark dust, red nebula, and including billions of Sun-like stars. Comet C/2025 A6 (Lemmon) is already fading as it heads back into the outer Solar System, while the Himalayan mountains will gradually erode over the next billion years. The Milky Way Galaxy, though, will live on -- forming new mountains and comets -- for many billions of years into the future.
Authors & editors: Robert Nemiroff (MTU) & Jerry Bonnell (UMCP)
NASA Official: Amber Straughn Specific rights apply.")
Alt...
2025 November 25
A night skyscape is shown over snowcapped mountains. On the left is the band of the Milky Way Galaxy, while on the right is a bright comet with two tails -- a white tail going up and trailing to the right and a longer blue tail going up and trailing off to the left.
Comet Lemmon and the Milky Way
* Image Credit & Copyright: Lin Zixuan (Tsinghua U.)
Explanation:
What did Comet Lemmon look like when it was at its best? One example is pictured here, featuring three celestial spectacles all at different distances. The closest spectacle is the snowcapped Meili Mountains, part of the Himalayas in China. The middle marvel is Comet Lemmon near its picturesque best early this month, showing not only a white dust tail trailing off to the right but its blue solar wind-distorted ion tail trailing off to the left. Far in the distance on the left is the magnificent central plane of our Milky Way Galaxy, featuring dark dust, red nebula, and including billions of Sun-like stars. Comet C/2025 A6 (Lemmon) is already fading as it heads back into the outer Solar System, while the Himalayan mountains will gradually erode over the next billion years. The Milky Way Galaxy, though, will live on -- forming new mountains and comets -- for many billions of years into the future.
Authors & editors: Robert Nemiroff (MTU) & Jerry Bonnell (UMCP)
NASA Official: Amber Straughn Specific rights apply.
Wolf-Rayet Apep Visualization — James Webb Space Telescope
This scientific visualization models what three of the four dust shells sent out by two Wolf-Rayet stars in the Apep system look like in 3D based on mid-infrared observations from NASA’s James Webb Space Telescope. Apep is made up of two Wolf-Rayet binary stars that are orbiting together with a third supergiant star. For 25 years during every 190-year orbit, the Wolf-Rayet stars’ winds collide, producing and sending out new waves of amorphous carbon dust. The width of the widest bubble is at least 4.6 light-years across.
Credit:
Video: NASA, ESA, CSA, STScI
Simulation: Yinuo Han (CALTECH), Ryan White (Macquarie University)
Image processing: Alyssa Pagan (STScI)
Visualization: Christian Nieves (STScI)
#space #nebula #astrophotography #photography #science #astronomy #physics #nature #NASA #ESA #APOD
![[?]](https://cdn.masto.host/mastodongamedevplace/accounts/avatars/109/859/285/072/781/117/original/52b616f54f20c98f.png)
Booster 18 (B18) had a catastrophic failure during pressure testing overnight.
Pretty bad news as it was the first of the new design to go with the v3 spacex starships and this was not an engine failure (the engines weren't installed) but something pretty fundamental.
Video from nsf.live
Alt...
A very large rocket with no engines on a test stand ruptures in a massive cloud of air and dust as it loses integrity suddenly. A lot like a balloon being over inflated.

Alt...
The same booster the following a day, a giant gash of twisted metal runs along the side, exposing the insides.

Alt...
The same booster the following a day and a closer view of the rupture.
2025 November 24
Apep: Unusual Dust Shells from Webb
* Image Credit: NASA, ESA, CSA, STScI, JWST
https://www.nasa.gov/
https://www.esa.int/
https://www.asc-csa.gc.ca/eng/
https://www.stsci.edu/
https://science.nasa.gov/mission/webb/about-overview/
* Science: Y. Han (Caltech), R. White (Macquarie U.)
https://www.gps.caltech.edu/people/yinuo-han
https://www.gps.caltech.edu/
https://researchers.mq.edu.au/en/persons/ryan-white/
https://www.mq.edu.au/
* Image Processing: A. Pagan (STScI)
https://www.linkedin.com/in/alyssa-pagan-058170144
Explanation:
What created this unusual space sculpture? Stars. This unusual system of swirls and shells, known as Apep, was observed in unprecedented detail by NASA’s James Webb Space Telescope in infrared light in 2024. Observations indicate that the unusual shape originates from two massive Wolf-Rayet stars orbiting each other every 190 years with each close passes causing a new shell of dust and gas to be expelled. Holes in these shells are thought to be caused by a third orbiting star. This stellar dust dance will likely continue for hundreds of thousands of years, possibly ending only when one of the massive stars runs out of internal nuclear fuel and explodes in a supernova punctuated by a burst of gamma-rays.
https://science.nasa.gov/asset/webb/wolf-rayet-apep-miri-image/
https://apod.nasa.gov/apod/ap250129.html
https://en.wikipedia.org/wiki/List_of_most_massive_stars
https://en.wikipedia.org/wiki/Apep_(star_system)
https://science.nasa.gov/universe/stars/
https://science.nasa.gov/ems/07_infraredwaves/
https://science.nasa.gov/mission/webb/
https://www.nsf.gov/news/all-we-are-dust-interstellar-wind
https://apod.nasa.gov/apod/ap200304.html
https://www.youtube.com/watch?v=wymMn-SmALYhttps://www.youtube.com/watch?v=wymMn-SmALY
https://science.nasa.gov/universe/gamma-ray-bursts-harvesting-knowledge-from-the-universes-most-powerful-explosions/
https://apod.nasa.gov/apod/ap251124.html
#space #nebula #astrophotography #photography #science #astronomy #physics #nature #NASA #ESA #apod
, R. White (Macquarie U.)
* Image Processing: A. Pagan (STScI)
Explanation:
What created this unusual space sculpture? Stars. This unusual system of swirls and shells, known as Apep, was observed in unprecedented detail by NASA’s James Webb Space Telescope in infrared light in 2024. Observations indicate that the unusual shape originates from two massive Wolf-Rayet stars orbiting each other every 190 years with each close passes causing a new shell of dust and gas to be expelled. Holes in these shells are thought to be caused by a third orbiting star. This stellar dust dance will likely continue for hundreds of thousands of years, possibly ending only when one of the massive stars runs out of internal nuclear fuel and explodes in a supernova punctuated by a burst of gamma-rays.
Authors & editors: Robert Nemiroff (MTU) & Jerry Bonnell (UMCP)
NASA Official: Amber Straughn Specific rights apply.
NASA Web Privacy, Accessibility, Notices;
A service of: ASD at NASA / GSFC,
NASA Science Activation
& Michigan Tech. U.")
Alt...
2025 November 24
A starfield has a large and unusual red and orange nebula in the middle. The nebula seems to contain not only swirls but also nearly transparent shells.
Apep: Unusual Dust Shells from Webb
* Image Credit: NASA, ESA, CSA, STScI, JWST
* Science: Y. Han (Caltech), R. White (Macquarie U.)
* Image Processing: A. Pagan (STScI)
Explanation:
What created this unusual space sculpture? Stars. This unusual system of swirls and shells, known as Apep, was observed in unprecedented detail by NASA’s James Webb Space Telescope in infrared light in 2024. Observations indicate that the unusual shape originates from two massive Wolf-Rayet stars orbiting each other every 190 years with each close passes causing a new shell of dust and gas to be expelled. Holes in these shells are thought to be caused by a third orbiting star. This stellar dust dance will likely continue for hundreds of thousands of years, possibly ending only when one of the massive stars runs out of internal nuclear fuel and explodes in a supernova punctuated by a burst of gamma-rays.
Authors & editors: Robert Nemiroff (MTU) & Jerry Bonnell (UMCP)
NASA Official: Amber Straughn Specific rights apply.
NASA Web Privacy, Accessibility, Notices;
A service of: ASD at NASA / GSFC,
NASA Science Activation
& Michigan Tech. U.
2025 November 23
The Observable Universe
* Illustration Credit & Licence: Wikipedia, Pablo Carlos Budassi
https://commons.wikimedia.org/wiki/User:Unmismoobjetivo
https://pablocarlosbudassi.com/
Explanation:
How far can you see? Everything you can see, and everything you could possibly see, right now, assuming your eyes could detect all types of radiations around you -- is the observable universe. In light, the farthest we can see comes from the cosmic microwave background, a time 13.8 billion years ago when the universe was opaque like thick fog. Some neutrinos and gravitational waves that surround us come from even farther out, but humanity does not yet have the technology to detect them. The featured image illustrates the observable universe on an increasingly compact scale, with the Earth and Sun at the center surrounded by our Solar System, nearby stars, nearby galaxies, distant galaxies, filaments of early matter, and the cosmic microwave background. Cosmologists typically assume that our observable universe is just the nearby part of a greater entity known as "the universe" where the same physics applies. However, there are several lines of popular but speculative reasoning that assert that even our universe is part of a greater multiverse where either different physical constants occur, different physical laws apply, higher dimensions operate, or slightly different-by-chance versions of our standard universe exist.
https://en.wikipedia.org/wiki/Observable_universe
https://science.nasa.gov/mission/wmap/
https://en.wikipedia.org/wiki/Age_of_the_universe
https://icecube.wisc.edu/outreach/neutrinos/
https://www.ligo.caltech.edu/page/what-are-gw
https://en.wikipedia.org/wiki/Logarhttps://apod.nasa.gov/apod/ap180722.htmlithmic_scale
https://science.nasa.gov/solar-system/solar-system-facts/
http://www.atlasoftheuniverse.com/12lys.html
https://apod.nasa.gov/apod/ap110614.html
https://apod.nasa.gov/apod/ap250302.html
https://apod.nasa.gov/apod/ap231231.html
https://science.nasa.gov/astrophysics/science-questions/how-do-matter-energy-space-and-time-behave-under-the-extraordinarily-diverse-conditions-of-the-cosmos/
https://asterisk.apod.com/viewtopic.php?f=39&t=21958
https://en.wikipedia.org/wiki/Multiverse
https://apod.nasa.gov/apod/ap170401.html
https://medium.com/starts-with-a-bang/ask-ethan-96-is-the-multiverse-science-ecceb24fa2af
https://www.pbs.org/wgbh/nova/article/how-many-dimensions-does-the-universe-really-have/
https://apod.nasa.gov/apod/fap/ap251123.html
#space #universe #map #astronomy #astrophotography #photography #science #physics #NASA #apod

Alt...
Artist's logarithmic scale conception of the observable universe with the Solar System at the center, inner and outer planets, Kuiper belt, Oort cloud, Alpha Centauri, Perseus Arm, Milky Way galaxy, Andromeda galaxy, nearby galaxies, Cosmic Web, Cosmic microwave radiation and Big Bang's invisible plasma on the edge.
Created specially for Wikipedia.org by Pablo Carlos Budassi. Please mention original author's name along with each image copy you use. Suggestions for making this illustration more accurate and descriptions on other languages are welcome.
The Celestial Zoo' poster 👉 https://bit.ly/celestialzoo
A circular plot that shows in detail astronomical objects of various distances and sizes thanks to the use of a logarithmic scale. The solar system is located in the center. Towards the edges, the scale is progressively reduced to show in detail the most distant and biggest structures of the observable universe sphere.
A high-resolution download: https://payhip.com/b/ZWy5S
Quality metal plate: https://displate.com/artist/pablocarlosbudassi/maps-of-the-universe
Many things are commented on this image. Most people say it’s the eye of the universe looking back at us, making us feel small and humble, or maybe making us feel great and lucky. Lucky to be able to stare at the cosmic beauty. With a bone-deep certainty that in all this diversity we cannot be the only ones!
https://pablocarlosbudassi.com/2021/02/the-infographic-and-artistic-work-named.html
#space #universe #map #astronomy #astrophotography #photography #science #nature #NASA #ESA
Alt...
Many things are commented on this image. Most people say it’s the eye of the universe looking back at us, making us feel small and humble, or maybe making us feel great and lucky. Lucky to be able to stare at the cosmic beauty. With a bone-deep certainty that in all this diversity we cannot be the only ones!
TOPIC> As Far As We Can See
2022 March 16
The Observable Universe
* Illustration Credit & Licence: Wikipedia, Pablo Carlos Budassi
https://commons.wikimedia.org/wiki/User:Unmismoobjetivo
https://commons.wikimedia.org/wiki/File:Extended_universe_logarithmic_illustration_(English_annotated).png
Explanation:
How far can you see? Everything you can see, and everything you could possibly see, right now, assuming your eyes could detect all types of radiations around you -- is the observable universe. In light, the farthest we can see comes from the cosmic microwave background, a time 13.8 billion years ago when the universe was opaque like thick fog. Some neutrinos and gravitational waves that surround us come from even farther out, but humanity does not yet have the technology to detect them. The featured image illustrates the observable universe on an increasingly compact scale, with the Earth and Sun at the center surrounded by our Solar System, nearby stars, nearby galaxies, distant galaxies, filaments of early matter, and the cosmic microwave background. Cosmologists typically assume that our observable universe is just the nearby part of a greater entity known as "the universe" where the same physics applies. However, there are several lines of popular but speculative reasoning that assert that even our universe is part of a greater multiverse where either different physical constants occur, different physical laws apply, higher dimensions operate, or slightly different-by-chance versions of our standard universe exist.
https://en.wikipedia.org/wiki/Observable_universe
https://science.nasa.gov/astrophysics/science-questions/how-do-matter-energy-space-and-time-behave-under-the-extraordinarily-diverse-conditions-of-the-cosmos/
https://apod.nasa.gov/apod/ap180305.html
http://www.atlasoftheuniverse.com/12lys.html
https://science.nasa.gov/solar-system/solar-system-facts/
https://en.wikipedia.org/wiki/Age_of_the_universe
https://wmap.gsfc.nasa.gov/universe/bb_tests_cmb.html
https://en.wikipedia.org/wiki/Logarithmic_scale
Authors & editors: Robert Nemiroff (MTU) & Jerry Bonnell (UMCP)
NASA Official: Phillip Newman Specific rights apply.
#space #universe #map #astronomy #astrophotography #photography #science #nature #NASA #education

Alt...
2022 March 16
The featured illustration depicts the entire visible universe and representations of most of the notable objects in it.
The Observable Universe
* Illustration Credit & Licence: Wikipedia, Pablo Carlos Budassi
Explanation:
How far can you see? Everything you can see, and everything you could possibly see, right now, assuming your eyes could detect all types of radiations around you -- is the observable universe. In light, the farthest we can see comes from the cosmic microwave background, a time 13.8 billion years ago when the universe was opaque like thick fog. Some neutrinos and gravitational waves that surround us come from even farther out, but humanity does not yet have the technology to detect them. The featured image illustrates the observable universe on an increasingly compact scale, with the Earth and Sun at the center surrounded by our Solar System, nearby stars, nearby galaxies, distant galaxies, filaments of early matter, and the cosmic microwave background. Cosmologists typically assume that our observable universe is just the nearby part of a greater entity known as "the universe" where the same physics applies. However, there are several lines of popular but speculative reasoning that assert that even our universe is part of a greater multiverse where either different physical constants occur, different physical laws apply, higher dimensions operate, or slightly different-by-chance versions of our standard universe exist.
2013 March 25
Planck Maps the Microwave Background
* Image Credit: European Space Agency, Planck Collaboration
https://www.esa.int/
https://www.esa.int/Science_Exploration/Space_Science/Planck
Explanation:
What is our universe made of? To help find out, ESA launched the Planck satellite to map, in unprecedented detail, slight temperature differences on the oldest surface known -- the background sky left billions of years ago when our universe first became transparent to light. Visible in all directions, this cosmic microwave background is a complex tapestry that could only show the hot and cold patterns observed were the universe to be composed of specific types of energy that evolved in specific ways. The results, reported last week, confirm again that most of our universe is mostly composed of mysterious and unfamiliar dark energy, and that even most of the remaining matter energy is strangely dark. Additionally, Planck data impressively peg the age of the universe at about 13.81 billion years, slightly older than that estimated by various other means including NASA's WMAP satellite, and the expansion rate at 67.3 (+/- 1.2) km/sec/Mpc, slightly lower than previous estimates. Some features of the above sky map remain unknown, such as why the temperature fluctuations seem to be slightly greater on one half of the sky than the other.
https://apod.nasa.gov/apod/ap130325.html
#space #universe #map #astronomy #astrophotography #photography #science #nature #NASA #ESA #education
 km/sec/Mpc, slightly lower than previous estimates. Some features of the above sky map remain unknown, such as why the temperature fluctuations seem to be slightly greater on one half of the sky than the other.
Authors & editors: Robert Nemiroff (MTU) & Jerry Bonnell (UMCP)
NASA Official: Phillip Newman Specific rights apply.
NASA Web Privacy Policy and Important Notices
A service of: ASD at NASA / GSFC
& Michigan Tech. U.")
Alt...
2013 March 25
Planck Maps the Microwave Background
* Image Credit: European Space Agency, Planck Collaboration
Explanation:
What is our universe made of? To help find out, ESA launched the Planck satellite to map, in unprecedented detail, slight temperature differences on the oldest surface known -- the background sky left billions of years ago when our universe first became transparent to light. Visible in all directions, this cosmic microwave background is a complex tapestry that could only show the hot and cold patterns observed were the universe to be composed of specific types of energy that evolved in specific ways. The results, reported last week, confirm again that most of our universe is mostly composed of mysterious and unfamiliar dark energy, and that even most of the remaining matter energy is strangely dark. Additionally, Planck data impressively peg the age of the universe at about 13.81 billion years, slightly older than that estimated by various other means including NASA's WMAP satellite, and the expansion rate at 67.3 (+/- 1.2) km/sec/Mpc, slightly lower than previous estimates. Some features of the above sky map remain unknown, such as why the temperature fluctuations seem to be slightly greater on one half of the sky than the other.
Authors & editors: Robert Nemiroff (MTU) & Jerry Bonnell (UMCP)
NASA Official: Phillip Newman Specific rights apply.
NASA Web Privacy Policy and Important Notices
A service of: ASD at NASA / GSFC
& Michigan Tech. U.
Planck finds no new evidence for cosmic anomalies
Science & Exploration
06/06/2019
ESA’s Planck satellite has found no new evidence for the puzzling cosmic anomalies that appeared in its temperature map of the Universe. The latest study does not rule out the potential relevance of the anomalies but they do mean astronomers must work even harder to understand the origin of these puzzling features.
Planck’s latest results come from an analysis of the polarisation of the Cosmic Microwave Background (CMB) radiation – the most ancient light in cosmic history, released when the Universe was just 380 000 years old.
The satellite’s initial analysis, which was made public in 2013, concentrated on the temperature of this radiation across the sky. This allows astronomers to investigate the origin and evolution of the cosmos. While it mostly confirmed the standard picture of how our Universe evolves, Planck’s first map also revealed a number of anomalies that are difficult to explain within the standard model of cosmology.
The anomalies are faint features on the sky that appear at large angular scales. They are definitely not artefacts produced by the behaviour of the satellite or the data processing, but they are faint enough that they could be statistical flukes – fluctuations which are extremely rare but not entirely ruled out by the standard model.
Alternatively, the anomalies might be a sign of ‘new physics’, the term used for as-yet unrecognised natural processes that would extend the known laws of physics.
Read more:
>>> https://www.esa.int/Science_Exploration/Space_Science/Planck/Planck_finds_no_new_evidence_for_cosmic_anomalies
Credit:
ESA/Planck Science Exploration
#space #universe #map #astronomy #astrophotography #photography #science #nature #NASA #ESA #education
Alt...
Planck finds no new evidence for cosmic anomalies
Science & Exploration
06/06/2019
ESA’s Planck satellite has found no new evidence for the puzzling cosmic anomalies that appeared in its temperature map of the Universe. The latest study does not rule out the potential relevance of the anomalies but they do mean astronomers must work even harder to understand the origin of these puzzling features.
Planck’s latest results come from an analysis of the polarisation of the Cosmic Microwave Background (CMB) radiation – the most ancient light in cosmic history, released when the Universe was just 380 000 years old.
The satellite’s initial analysis, which was made public in 2013, concentrated on the temperature of this radiation across the sky. This allows astronomers to investigate the origin and evolution of the cosmos. While it mostly confirmed the standard picture of how our Universe evolves, Planck’s first map also revealed a number of anomalies that are difficult to explain within the standard model of cosmology.
The anomalies are faint features on the sky that appear at large angular scales. They are definitely not artefacts produced by the behaviour of the satellite or the data processing, but they are faint enough that they could be statistical flukes – fluctuations which are extremely rare but not entirely ruled out by the standard model.
Credit:
ESA/Planck Science Exploration

Alt...
..
The timeline in the upper part of the illustration shows an artistic view of the evolution of the cosmos on large scales. The processes depicted range from inflation, the brief era of accelerated expansion that the Universe underwent when it was a tiny fraction of a second old, to the release of the CMB, the oldest light in our Universe, imprinted on the sky when the cosmos was just 380 000 years old; and from the ‘Dark Ages’ to the birth of the first stars and galaxies, which reionised the Universe when it was a few hundred million years old, all the way to the present time.
Tiny quantum fluctuations generated during the inflationary epoch are the seeds of future structure: the stars and galaxies of today. After the end of inflation, dark matter particles started to clump around these cosmic seeds, slowly building a cosmic web of structures. Later, after the release of the CMB, normal matter started to fall into these structures, eventually giving rise to stars and galaxies.
The inserts below show a zoomed-in view on some of the microscopic processes taking place during cosmic history: from the tiny fluctuations generated during inflation, to the dense soup of light and particles that filled the early Universe; from the last scattering of light off electrons, which gave rise to the CMB and its polarisation, to the reionisation of the Universe, caused by the first stars and galaxies, which induced additional polarisation on the CMB.
 polarization amplitude as observed by ESA’s Planck satellite. While fluctuations in the CMB are present and were observed by Planck down to very small angular scales, these images have been filtered to show mostly the signal detected on fairly large scales in the sky, around 5 degrees – as a comparison, the full Moon spans about half a degree.
On these large scales, a number of anomalies are observed in the CMB temperature – these are features that are difficult to explain within the standard model of cosmology, which relies on the assumption that the Universe, on large scales, has the same properties when observed in all directions.
The most serious anomaly is a deficit in the signal observed on scales around 5 degrees, which is about ten per cent weaker than predicted. Other anomalous traits are a significant discrepancy of the signal as observed in the two opposite hemispheres of the sky and a so-called 'cold spot' – a large, low-temperature spot with an unusually steep temperature profile (the location of this spot is also outlined in the lower right).
A comparison between the top map, showing the total Planck measurement – comprising both signal and noise – with the bottom map, showing only the noise, indicates that some anomalous features may be present, such as for example a power asymmetry between the two hemispheres, but they are statistically unconvincing.")
Alt...
Map of the cosmic microwave background (CMB) polarization amplitude as observed by ESA’s Planck satellite. While fluctuations in the CMB are present and were observed by Planck down to very small angular scales, these images have been filtered to show mostly the signal detected on fairly large scales in the sky, around 5 degrees – as a comparison, the full Moon spans about half a degree.
On these large scales, a number of anomalies are observed in the CMB temperature – these are features that are difficult to explain within the standard model of cosmology, which relies on the assumption that the Universe, on large scales, has the same properties when observed in all directions.
The most serious anomaly is a deficit in the signal observed on scales around 5 degrees, which is about ten per cent weaker than predicted. Other anomalous traits are a significant discrepancy of the signal as observed in the two opposite hemispheres of the sky and a so-called 'cold spot' – a large, low-temperature spot with an unusually steep temperature profile (the location of this spot is also outlined in the lower right).
A comparison between the top map, showing the total Planck measurement – comprising both signal and noise – with the bottom map, showing only the noise, indicates that some anomalous features may be present, such as for example a power asymmetry between the two hemispheres, but they are statistically unconvincing.
 temperature as observed by ESA’s Planck satellite. While fluctuations in the CMB are present and were observed by Planck down to very small angular scales, these images have been filtered to show mostly the signal detected on fairly large scales in the sky, around 5 degrees and larger – as a comparison, the full Moon spans about half a degree.
On these large scales, a number of anomalies are observed in the CMB temperature – these are features that are difficult to explain within the standard model of cosmology, which relies on the assumption that the Universe, on large scales, has the same properties when observed in all directions.
The most serious anomaly is a deficit in the signal observed on scales around 5 degrees, which is about ten per cent weaker than predicted. Other anomalous traits are a significant discrepancy of the signal as observed in the two opposite hemispheres of the sky (the two hemispheres are outlined by the large, roughly u-shaped curve in the image, the northern one being at the centre) and a so-called 'cold spot' – a large, low-temperature spot with an unusually steep temperature profile (also outlined in the lower right).
A comparison between the top map, showing the total Planck measurement – comprising both signal and noise – with the bottom map, showing only the noise, indicates that the anomalous features are clearly not artefacts as they are indeed present in the signal and not in the noise.")
Alt...
Map of the cosmic microwave background (CMB) temperature as observed by ESA’s Planck satellite. While fluctuations in the CMB are present and were observed by Planck down to very small angular scales, these images have been filtered to show mostly the signal detected on fairly large scales in the sky, around 5 degrees and larger – as a comparison, the full Moon spans about half a degree.
On these large scales, a number of anomalies are observed in the CMB temperature – these are features that are difficult to explain within the standard model of cosmology, which relies on the assumption that the Universe, on large scales, has the same properties when observed in all directions.
The most serious anomaly is a deficit in the signal observed on scales around 5 degrees, which is about ten per cent weaker than predicted. Other anomalous traits are a significant discrepancy of the signal as observed in the two opposite hemispheres of the sky (the two hemispheres are outlined by the large, roughly u-shaped curve in the image, the northern one being at the centre) and a so-called 'cold spot' – a large, low-temperature spot with an unusually steep temperature profile (also outlined in the lower right).
A comparison between the top map, showing the total Planck measurement – comprising both signal and noise – with the bottom map, showing only the noise, indicates that the anomalous features are clearly not artefacts as they are indeed present in the signal and not in the noise.
2011 June 14
The Universe Nearby
* Credit: 2MASS, T. H. Jarrett, J. Carpenter, & R. Hurt
https://www.ipac.caltech.edu/2mass/
Explanation:
What does the universe nearby look like? This plot shows nearly 50,000 galaxies in the nearby universe detected by the Two Micron All Sky Survey (2MASS) in infrared light. The resulting image is anincredible tapestry of galaxies that provides limits on how the universe formed and evolved. The dark band across the image center is blocked by dust in the plane of our own Milky Way Galaxy. Away from the Galactic plane, however, each dot represents a galaxy, color coded to indicate distance. Bluer dots represent the nearer galaxies in the 2MASS survey, while redder dots indicating the more distant survey galaxies that lie at a redshift near 0.1. Named structures are annotated around the edges. Many galaxies are gravitationally bound together to form clusters, which themselves are loosely bound into superclusters, which in turn are sometimes seen to align over even larger scale structures.
https://apod.nasa.gov/apod/ap110614.html
#space #universe #map #astronomy #astrophotography #photography #science #nature #NASA #ESA #education
 in infrared light. The resulting image is anincredible tapestry of galaxies that provides limits on how the universe formed and evolved. The dark band across the image center is blocked by dust in the plane of our own Milky Way Galaxy. Away from the Galactic plane, however, each dot represents a galaxy, color coded to indicate distance. Bluer dots represent the nearer galaxies in the 2MASS survey, while redder dots indicating the more distant survey galaxies that lie at a redshift near 0.1. Named structures are annotated around the edges. Many galaxies are gravitationally bound together to form clusters, which themselves are loosely bound into superclusters, which in turn are sometimes seen to align over even larger scale structures.
Authors & editors: Robert Nemiroff (MTU) & Jerry Bonnell (UMCP)
NASA Official: Phillip Newman Specific rights apply.
NASA Web Privacy Policy and Important Notices
A service of: ASD at NASA / GSFC
& Michigan Tech. U.")
Alt...
2011 June 14
The Universe Nearby
* Credit: 2MASS, T. H. Jarrett, J. Carpenter, & R. Hurt
Explanation:
What does the universe nearby look like? This plot shows nearly 50,000 galaxies in the nearby universe detected by the Two Micron All Sky Survey (2MASS) in infrared light. The resulting image is anincredible tapestry of galaxies that provides limits on how the universe formed and evolved. The dark band across the image center is blocked by dust in the plane of our own Milky Way Galaxy. Away from the Galactic plane, however, each dot represents a galaxy, color coded to indicate distance. Bluer dots represent the nearer galaxies in the 2MASS survey, while redder dots indicating the more distant survey galaxies that lie at a redshift near 0.1. Named structures are annotated around the edges. Many galaxies are gravitationally bound together to form clusters, which themselves are loosely bound into superclusters, which in turn are sometimes seen to align over even larger scale structures.
Authors & editors: Robert Nemiroff (MTU) & Jerry Bonnell (UMCP)
NASA Official: Phillip Newman Specific rights apply.
NASA Web Privacy Policy and Important Notices
A service of: ASD at NASA / GSFC
& Michigan Tech. U.
2023 July 5
A Map of the Observable Universe
* Image Credit & Copyright: B. Ménard & N. Shtarkman; Data: SDSS, Planck, JHU, Sloan, NASA, ESA
Explanation:
What if you could see out to the edge of the observable universe? You would see galaxies, galaxies, galaxies, and then, well, quasars, which are the bright centers of distant galaxies. To expand understanding of the very largest scales that humanity can see, a map of the galaxies and quasars found by the Sloan Digital Sky Survey from 2000 to 2020 -- out to near the edge of the observable universe -- has been composed. Featured here, one wedge from this survey encompasses about 200,000 galaxies and quasars out beyond a look-back time of 12 billion years and cosmological redshift 5. Almost every dot in the nearby lower part of the illustration represents a galaxy, with redness indicating increasing redshift and distance. Similarly, almost every dot on the upper part represents a distant quasar, with blue-shaded dots being closer than red. Clearly shown among many discoveries, gravity between galaxies has caused the nearby universe to condense and become increasingly more filamentary than the distant universe.
!>> https://mapoftheuniverse.net/
https://apod.nasa.gov/apod/ap230705.html
#space #universe #map #astronomy #astrophotography #photography #science #nature #NASA #ESA #education
 & Jerry Bonnell (UMCP)
NASA Official: Phillip Newman Specific rights apply.")
Alt...
2023 July 5
A map of the observable universe is illustrated in a wedge with the the Earth on the bottom and the universe fanning out above. Please see the explanation for more detailed information.
A Map of the Observable Universe
* Image Credit & Copyright: B. Ménard & N. Shtarkman; Data: SDSS, Planck, JHU, Sloan, NASA, ESA
Explanation:
What if you could see out to the edge of the observable universe? You would see galaxies, galaxies, galaxies, and then, well, quasars, which are the bright centers of distant galaxies. To expand understanding of the very largest scales that humanity can see, a map of the galaxies and quasars found by the Sloan Digital Sky Survey from 2000 to 2020 -- out to near the edge of the observable universe -- has been composed. Featured here, one wedge from this survey encompasses about 200,000 galaxies and quasars out beyond a look-back time of 12 billion years and cosmological redshift 5. Almost every dot in the nearby lower part of the illustration represents a galaxy, with redness indicating increasing redshift and distance. Similarly, almost every dot on the upper part represents a distant quasar, with blue-shaded dots being closer than red. Clearly shown among many discoveries, gravity between galaxies has caused the nearby universe to condense and become increasingly more filamentary than the distant universe.
Authors & editors: Robert Nemiroff (MTU) & Jerry Bonnell (UMCP)
NASA Official: Phillip Newman Specific rights apply.
2014 May 12
Illustris Simulation of the Universe
* Video Credit: Illustris Collaboration, NASA, PRACE, XSEDE, MIT, Harvard CfA;
https://physics.mit.edu/faculty/mark-vogelsberger/
https://www.illustris-project.org/people/
https://prace-ri.eu/
https://www.cfa.harvard.edu/
https://www.xsede.org/
https://www.nasa.gov/
* Music: The Poisoned Princess (Media Right Productions)
https://www.mediarightproductions.com/
Explanation:
How did we get here? Click play, sit back, and watch. A new computer simulation of the evolution of the universe -- the largest and most sophisticated yet produced -- provides new insight into how galaxies formed and new perspectives into humanity's place in the universe. The Illustris project -- the largest of its type yet -- exhausted 20 million CPU hours following 12 billion resolution elements spanning a cube 35 million light years on a side as it evolved over 13 billion years. The simulation is the first to track matter into the formation of a wide variety of galaxy types. As the virtual universe evolves, some of the matter expanding with the universe soon gravitationally condenses to form filaments, galaxies, and clusters of galaxies. The above video takes the perspective of a virtual camera circling part of this changing universe, first showing the evolution of dark matter, then hydrogen gas coded by temperature (0:45), then heavy elements such as helium and carbon (1:30), and then back to dark matter (2:07). On the lower left the time since the Big Bang is listed, while on the lower right the type of matter being shown is listed. Explosions (0:50) depict galaxy-center supermassive black holes expelling bubbles of hot gas. Interesting discrepancies between Illustris and the real universe do exist and are being studied, including why the simulation produces an overabundance of old stars.
https://apod.nasa.gov/apod/ap140512.html
* i converted and compressed this video to mp4 -crf 28 with ffmpeg
#space #universe #map #astronomy #astrophotography #photography #science #nature #NASA #ESA #education
Alt...
2014 May 12
Illustris Simulation of the Universe
* Video Credit: Illustris Collaboration, NASA, PRACE, XSEDE, MIT, Harvard CfA;
* Music: The Poisoned Princess (Media Right Productions)
Explanation:
How did we get here? Click play, sit back, and watch. A new computer simulation of the evolution of the universe -- the largest and most sophisticated yet produced -- provides new insight into how galaxies formed and new perspectives into humanity's place in the universe. The Illustris project -- the largest of its type yet -- exhausted 20 million CPU hours following 12 billion resolution elements spanning a cube 35 million light years on a side as it evolved over 13 billion years. The simulation is the first to track matter into the formation of a wide variety of galaxy types. As the virtual universe evolves, some of the matter expanding with the universe soon gravitationally condenses to form filaments, galaxies, and clusters of galaxies. The above video takes the perspective of a virtual camera circling part of this changing universe, first showing the evolution of dark matter, then hydrogen gas coded by temperature (0:45), then heavy elements such as helium and carbon (1:30), and then back to dark matter (2:07). On the lower left the time since the Big Bang is listed, while on the lower right the type of matter being shown is listed. ..
Authors & editors: Robert Nemiroff (MTU) & Jerry Bonnell (UMCP)
NASA Official: Phillip Newman Specific rights apply.
Illustris simulation overview poster. Shows the large scale dark matter and gas density fields in projection (top/bottom). The lower three panels show gas temperature, entropy, and velocity at the same scale. Centered on the most massive cluster, for which the circular insets show four predicted observables. The two galaxy insets highlight a central elliptical and a spiral disk satellite (top/bottom).
Credits:
Illustris
www.illustris-project.org
#space #universe #map #astronomy #astrophotography #photography #science #nature #NASA #ESA #education
. The lower three panels show gas temperature, entropy, and velocity at the same scale. Centered on the most massive cluster, for which the circular insets show four predicted observables. The two galaxy insets highlight a central elliptical and a spiral disk satellite (top/bottom).")
Alt...
Illustris simulation overview poster. Shows the large scale dark matter and gas density fields in projection (top/bottom). The lower three panels show gas temperature, entropy, and velocity at the same scale. Centered on the most massive cluster, for which the circular insets show four predicted observables. The two galaxy insets highlight a central elliptical and a spiral disk satellite (top/bottom).
Most detailed simulation of our Universe
The Illustris simulation is the most ambitious computer simulation of our Universe yet performed. The calculation tracks the expansion of the universe, the gravitational pull of matter onto itself, the motion of cosmic gas, as well as the formation of stars and black holes. These physical components and processes are all modeled starting from initial conditions resembling the very young universe 300,000 years after the Big Bang and until the present day, spanning over 13.8 billion years of cosmic evolution. The simulated volume contains tens of thousands of galaxies captured in high-detail, covering a wide range of masses, rates of star formation, shapes, sizes, and with properties that agree well with the galaxy population observed in the real universe. The simulations were run on supercomputers in France, Germany, and the US. The largest was run on 8,192 compute cores, and took 19 million CPU hours. A single state-of-the-art desktop computer would require more than 2000 years to perform this calculation.
Find out more at:
http://www.illustris-project.org
Publication:
"Properties of galaxies reproduced by a hydrodynamic simulation", Vogelsberger, Genel, Springel, Torrey, Sijacki, Xu, Snyder, Bird, Nelson, Hernquist, Nature 509, 177-182 (08 May 2014) doi:10.1038/nature13316
Music:
moonbooter (http://www.moonbooter.de/)
Institutes:
Massachusetts Institute of Technology, Harvard University, Heidelberg Institute for Theoretical Studies, University of Cambridge, Institute for Advanced Study Princeton, Space Telescope Science Institute
-The Illustris Collaboration
https://www.illustris-project.org/
* i converted and compressed this video to mp4 -crf 33 with ffmpeg
#space #universe #map #astronomy #astrophotography #photography #science #nature #NASA #ESA #education

Alt...
The Illustris simulation is the most ambitious computer simulation of our Universe yet performed. The calculation tracks the expansion of the universe, the gravitational pull of matter onto itself, the motion of cosmic gas, as well as the formation of stars and black holes. These physical components and processes are all modeled starting from initial conditions resembling the very young universe 300,000 years after the Big Bang and until the present day, spanning over 13.8 billion years of cosmic evolution. The simulated volume contains tens of thousands of galaxies captured in high-detail, covering a wide range of masses, rates of star formation, shapes, sizes, and with properties that agree well with the galaxy population observed in the real universe. The simulations were run on supercomputers in France, Germany, and the US. The largest was run on 8,192 compute cores, and took 19 million CPU hours. A single state-of-the-art desktop computer would require more than 2000 years to perform this calculation.
Institutes:
Massachusetts Institute of Technology, Harvard University, Heidelberg Institute for Theoretical Studies, University of Cambridge, Institute for Advanced Study Princeton, Space Telescope Science Institute
* i converted and compressed this video to mp4 -crf 33 with ffmpeg
Saturn Moons
more about:
+ Dione
https://science.nasa.gov/saturn/moons/dione/
+ Rhea
https://science.nasa.gov/saturn/moons/rhea/
+ Helene
https://science.nasa.gov/saturn/moons/helene/
+ Atlas
https://science.nasa.gov/saturn/moons/atlas/
Please read the ALT-Texts for short overviews.
#space #saturn #astrophotography #photography #science #astronomy #physics #nature #NASA #ESA #education
 in mean radius orbiting Saturn every 2.7 days at a distance of 234,500 miles (377,400 km), which is roughly the same distance that our Moon orbits Earth.
Dione's density is 1.48 times that of liquid water, suggesting that about a third of Dione is made up of a dense core (probably silicate rock) with the remainder of its material being ice. At Dione's average temperature of -304 degrees Fahrenheit (-186 degrees Celsius or 87 kelvins), ice is very hard and behaves like rock.
Very fine ice powder (equivalent to smoke) from Saturn's E-ring constantly bombards Dione. The dust in the E-ring ultimately comes from Enceladus, which has prominent geyser activity.")
Alt...
Saturn's moon Dione is captured in this view from NASA's Cassini spacecraft, half in shadow and half in light.
NASA/JPL-Caltech/Space Science Institute
Dione
is a small moon of 349 miles (562 km) in mean radius orbiting Saturn every 2.7 days at a distance of 234,500 miles (377,400 km), which is roughly the same distance that our Moon orbits Earth.
Dione's density is 1.48 times that of liquid water, suggesting that about a third of Dione is made up of a dense core (probably silicate rock) with the remainder of its material being ice. At Dione's average temperature of -304 degrees Fahrenheit (-186 degrees Celsius or 87 kelvins), ice is very hard and behaves like rock.
Very fine ice powder (equivalent to smoke) from Saturn's E-ring constantly bombards Dione. The dust in the E-ring ultimately comes from Enceladus, which has prominent geyser activity.
 it is less than a third the radius of Saturn's largest moon, Titan. Rhea is a small, cold, airless body that is very similar to sister moons Dione and Tethys. As with the other two moons, Rhea is tidally locked in phase with its parent — one side always faces toward Saturn — as it completes its 4.5-Earth-day orbit around the planet. Rhea's surface temperatures are also similar to Dione and Tethys, being roughly as warm as -281 degrees Fahrenheit (-174 degrees Celsius) in sunlit areas and ranging down to -364 degrees Fahrenheit (-220 degrees Celsius) in shaded areas. Also like Dione and Tethys, Rhea has a high reflectivity (or geometric albedo) suggesting a surface composition largely of water ice, which behaves like rock in Rhea's temperature range.
Rhea's density of 1.233 times that of liquid water suggests that Rhea is three quarters ice and one quarter rock. Cassini spacecraft measurements from a close encounter showed a moment of inertia about its axis (a measure of how difficult it is to change its rotation) of a higher value than what would be expected if Rhea has a rocky core. Thus, it is thought that Rhea is composed of a homogenous mixture of ice and rock — a frozen dirty snowball at a distance of 327,500 miles (527,000 kilometers)")
Alt...
The Cassini spacecraft looks toward the cratered plains of the trailing hemisphere of Rhea.
NASA/JPL/Space Science Institute
Rhea is the second largest moon of Saturn, but with a mean radius of 475 miles (764 kilometers) it is less than a third the radius of Saturn's largest moon, Titan. Rhea is a small, cold, airless body that is very similar to sister moons Dione and Tethys. As with the other two moons, Rhea is tidally locked in phase with its parent — one side always faces toward Saturn — as it completes its 4.5-Earth-day orbit around the planet. Rhea's surface temperatures are also similar to Dione and Tethys, being roughly as warm as -281 degrees Fahrenheit (-174 degrees Celsius) in sunlit areas and ranging down to -364 degrees Fahrenheit (-220 degrees Celsius) in shaded areas. Also like Dione and Tethys, Rhea has a high reflectivity (or geometric albedo) suggesting a surface composition largely of water ice, which behaves like rock in Rhea's temperature range.
Rhea's density of 1.233 times that of liquid water suggests that Rhea is three quarters ice and one quarter rock. Cassini spacecraft measurements from a close encounter showed a moment of inertia about its axis (a measure of how difficult it is to change its rotation) of a higher value than what would be expected if Rhea has a rocky core. Thus, it is thought that Rhea is composed of a homogenous mixture of ice and rock — a frozen dirty snowball at a distance of 327,500 miles (527,000 kilometers)
 with dimensions 22 x 19 x 18.6 miles (36 x 32 x 30 km). It orbits 234,505 miles (377,400 kilometers) away from Saturn, taking 2.7 Earth days to complete one orbit.")
Alt...
Although travelling at great speed, the Cassini spacecraft managed to capture this close view of Saturn's small moon Helene during a flyby on March 3, 2010.
NASA/JPL/Space Science Institute
Helene, a small and faint moon of Saturn, is referred to as a Trojan moon because it shares its orbit with another moon—Dione, a moon hundreds of times larger than Helene. This complex orbital arrangement is held steady by gravity: Helene is located at a Lagrange point, where it feels the tug of gravity equally from distant Saturn and nearby Dione. For this reason, soon after it was discovered in 1980 it was called Dione B.
This irregularly shaped moon has a mean radius of 10.9 miles (17.6 kilometers) with dimensions 22 x 19 x 18.6 miles (36 x 32 x 30 km). It orbits 234,505 miles (377,400 kilometers) away from Saturn, taking 2.7 Earth days to complete one orbit.
. It orbits 85,544 miles (137,670 km) away from, taking 14.4 hours to complete its trip around the planet.")
Alt...
This montage of views from NASA's Cassini spacecraft shows three of Saturn's small ring moons: Atlas, Daphnis and Pan at the same scale for ease of comparison.
NASA/JPL-Caltech/Space Science Institute
Atlas
is an inner moon of Saturn, orbiting around the outer edge of Saturn's A Ring. Like Pan, Atlas has a distinctive flying saucer shape created by a prominent equatorial ridge not seen on the other small moons of Saturn. Cassini images revealed in 2004 that a temporary faint ring of material with the orbit of Atlas.
The small, pointy moon has a mean radius of 9.4 miles (15.1 km). It orbits 85,544 miles (137,670 km) away from, taking 14.4 hours to complete its trip around the planet.
Saturn Moons
more about:
+ Iapetus
https://science.nasa.gov/saturn/moons/iapetus/
+ Phoebe
https://science.nasa.gov/saturn/moons/phoebe/
+ Tethys
https://science.nasa.gov/saturn/moons/tethys/
+ Telesto
https://science.nasa.gov/saturn/moons/telesto/
Please read the ALT-Texts for short overviews.
#space #saturn #astrophotography #photography #science #astronomy #physics #nature #NASA #ESA #education
 as dark as coal (albedo 0.03-0.05 with a slight reddish tinge) and its trailing hemisphere is much brighter at 0.5-0.6.
Saturn's third largest moon, Iapetus has a mean radius of 457 miles (736 kilometers) and a density only 1.2 times that of liquid water. It has been suggested that Iapetus (like Rhea) is three quarters ice and one quarter rock.
Iapetus orbits at 2,213,000 miles (3,561,000 kilometers) from Saturn. The great distance from Saturn's tidal forces and from most of the other moons and ring particles has probably allowed the Iapetus surface to be largely unaffected by any melting episodes that could have caused some smoothing or \"resurfacing\" as on some of the moons closer to Saturn.
However, despite the great distance, Saturn has tidally locked Iapetus. The moon always presents the same face toward Saturn. With its distant, inclined orbit, Iapetus is the only large moon from which there is a nice view of the rings of Saturn.
As with some other Saturnian moons, Iapetus is in resonance with Saturn's largest moon, Titan, which orbits at 759,200 miles (1,221,850 kilometers)")
Alt...
These two global images of Iapetus show the extreme brightness dichotomy on the surface of this peculiar Saturnian moon. The left-hand panel shows the moon's leading hemisphere and the right-hand panel shows the moon's trailing side.
NASA/JPL-Caltech/Space Science Institute
Iapetus
has been called the yin and yang of the Saturn moons because its leading hemisphere has a reflectivity (or albedo) as dark as coal (albedo 0.03-0.05 with a slight reddish tinge) and its trailing hemisphere is much brighter at 0.5-0.6.
Saturn's third largest moon, Iapetus has a mean radius of 457 miles (736 kilometers) and a density only 1.2 times that of liquid water. It has been suggested that Iapetus (like Rhea) is three quarters ice and one quarter rock.
Iapetus orbits at 2,213,000 miles (3,561,000 kilometers) from Saturn. The great distance from Saturn's tidal forces and from most of the other moons and ring particles has probably allowed the Iapetus surface to be largely unaffected by any melting episodes that could have caused some smoothing or "resurfacing" as on some of the moons closer to Saturn.
However, despite the great distance, Saturn has tidally locked Iapetus. The moon always presents the same face toward Saturn. With its distant, inclined orbit, Iapetus is the only large moon from which there is a nice view of the rings of Saturn.
As with some other Saturnian moons, Iapetus is in resonance with Saturn's largest moon, Titan, which orbits at 759,200 miles (1,221,850 kilometers)
 from the planet, almost four times the distance from Saturn than its nearest neighbor, the moon Iapetus. Phoebe and Iapetus are the only major moons in the Saturnian system that do not orbit closely to the plane of Saturn's equator.
Phoebe is roughly spherical and has a mean radius of about 66.2 miles (106.5 kilometers), about one-sixteenth the radius of Earth's Moon. Phoebe rotates on its axis every nine hours, and it completes a full orbit around Saturn in about 18 Earth months. Its irregular, elliptical orbit is inclined about 175 degrees to Saturn's equator. Phoebe's orbit is also retrograde, which means it goes around Saturn in the opposite direction than most other moons — as well as most objects in the solar system.
Unlike most major moons orbiting Saturn, Phoebe is very dark and reflects only 6 percent of the sunlight it receives. Its darkness and irregular, retrograde orbit suggest Phoebe is most likely a captured object. A captured object is a celestial body that is trapped by the gravitational pull of a much bigger body, generally a planet. Phoebe's darkness, in particular, suggests that the small moon comes from the outer solar system, an area where there is plenty of dark material.")
Alt...
Phoebe's true nature is revealed in startling clarity in this mosaic of two images taken during Cassini's flyby on June 11, 2004.
NASA/JPL
Phoebe
is one of Saturn's most intriguing moons, orbiting at a distance of 8,049,668 miles (12,952,000 kilometers) from the planet, almost four times the distance from Saturn than its nearest neighbor, the moon Iapetus. Phoebe and Iapetus are the only major moons in the Saturnian system that do not orbit closely to the plane of Saturn's equator.
Phoebe is roughly spherical and has a mean radius of about 66.2 miles (106.5 kilometers), about one-sixteenth the radius of Earth's Moon. Phoebe rotates on its axis every nine hours, and it completes a full orbit around Saturn in about 18 Earth months. Its irregular, elliptical orbit is inclined about 175 degrees to Saturn's equator. Phoebe's orbit is also retrograde, which means it goes around Saturn in the opposite direction than most other moons — as well as most objects in the solar system.
Unlike most major moons orbiting Saturn, Phoebe is very dark and reflects only 6 percent of the sunlight it receives. Its darkness and irregular, retrograde orbit suggest Phoebe is most likely a captured object. A captured object is a celestial body that is trapped by the gravitational pull of a much bigger body, generally a planet. Phoebe's darkness, in particular, suggests that the small moon comes from the outer solar system, an area where there is plenty of dark material.
 in mean radius, with dimensions 669 x 657 x 654 miles (1076.8 x 1057.4 x 1052.6 kilometers). This cold, airless and heavily scarred body is very similar to sister moons DionThe Voyager images showed a major impact crater and a great chasm. The Cassini spacecraft has added details including a great variety of colors at small scales suggesting a variety of materials not seen elsewhere.e and Rhea except that Tethys is not as heavily cratered as the other two. This may be because its proximity to Saturn causes more tidal warming, and that warming kept Tethys partially molten longer, erasing or dulling more of the early terrain.
Tethys' density is 0.97 times that of liquid water, which suggests that Tethys is composed almost entirely of water ice plus a small amount of rock.
Tethys has a high reflectivity (or visual albedo) of 1.229 in the visual range, again suggesting a composition largely of water ice, which would behave like rock in the Tethyan average temperature of -305 degrees Fahrenheit (-187 degrees Celsius). Many of the crater floors on Tethys are bright, which also suggests an abundance of water ice. Also contributing to the high reflectivity is that Tethys is bombarded by Saturn E-ring water-ice particles generated by geysers on Enceladus")
Alt...
The vast expanse of the crater Odysseus spreads out below Cassini in this mosaic view of Saturn's moon Tethys.
NASA/JPL/Space Science Institute
Tethys
is Saturn's fifth largest moon. Its irregular shape is 331 miles (533 kilometers) in mean radius, with dimensions 669 x 657 x 654 miles (1076.8 x 1057.4 x 1052.6 kilometers). This cold, airless and heavily scarred body is very similar to sister moons DionThe Voyager images showed a major impact crater and a great chasm. The Cassini spacecraft has added details including a great variety of colors at small scales suggesting a variety of materials not seen elsewhere.e and Rhea except that Tethys is not as heavily cratered as the other two. This may be because its proximity to Saturn causes more tidal warming, and that warming kept Tethys partially molten longer, erasing or dulling more of the early terrain.
Tethys' density is 0.97 times that of liquid water, which suggests that Tethys is composed almost entirely of water ice plus a small amount of rock.
Tethys has a high reflectivity (or visual albedo) of 1.229 in the visual range, again suggesting a composition largely of water ice, which would behave like rock in the Tethyan average temperature of -305 degrees Fahrenheit (-187 degrees Celsius). Many of the crater floors on Tethys are bright, which also suggests an abundance of water ice. Also contributing to the high reflectivity is that Tethys is bombarded by Saturn E-ring water-ice particles generated by geysers on Enceladus
 from Saturn, the moon takes 45.3 hours to make one trip around the planet. Telesto orbits about 60 degrees ahead of Tethys, while Calypso orbits behind Tethys by about 60 degrees. Because Telesto is in the front of this three-moon group, it is called the \"leading Trojan.\"
Telesto is 7.7 miles (12.4 kilometers) in mean radius and appears to have a smooth, icy surface. It does not show the signs of intense cratering seen on many of Saturn's other moons.")
Alt...
The Cassini spacecraft passed within a cosmic stone's throw of Telesto in October, 2005 capturing this shot of the tiny Trojan moon.
NASA/JPL/Space Science Institute
Telesto
is known as a "Tethys Trojan" because, together with Calypso, it circles Saturn in the same orbit as the moon Tethys. At a distance of about 183,000 miles (295,000 kilometers) from Saturn, the moon takes 45.3 hours to make one trip around the planet. Telesto orbits about 60 degrees ahead of Tethys, while Calypso orbits behind Tethys by about 60 degrees. Because Telesto is in the front of this three-moon group, it is called the "leading Trojan."
Telesto is 7.7 miles (12.4 kilometers) in mean radius and appears to have a smooth, icy surface. It does not show the signs of intense cratering seen on many of Saturn's other moons.
Saturn Moons
more about:
+ Pandora
https://science.nasa.gov/saturn/moons/pandora/
+ Janus
https://science.nasa.gov/saturn/moons/janus/
+ Epimetheus
https://science.nasa.gov/saturn/moons/epimetheus/
+ Mimas
https://science.nasa.gov/saturn/moons/mimas/
Please read the ALT-Texts for short overviews.
#space #saturn #astrophotography #photography #science #astronomy #physics #nature #NASA #ESA #education
 icy material. Even the craters on Pandora are coated in debris, a stark contrast to the crisply-defined craters of other moons, such as Hyperion. Curious grooves and ridges also appear to cross the surface of the small moon.
Pandora is interesting because it tends to disrupt the F ring, while Prometheus helps to keep the primary ring in place.
Pandora is about 25.3 miles (40.7 kilometers) in mean radius. It orbits 88,000 miles (142,000 kilometers) away from Saturn, near the F ring, taking 15.1 hours to go around Saturn.")
Alt...
Cassini's best close-up view of Saturn's F ring shepherd moon, Pandora, shows that this small ring-moon is coated in fine dust-sized icy material.
NASA/JPL
Pandora,
a potato-shaped moon, is coated in a fine (dust-sized) icy material. Even the craters on Pandora are coated in debris, a stark contrast to the crisply-defined craters of other moons, such as Hyperion. Curious grooves and ridges also appear to cross the surface of the small moon.
Pandora is interesting because it tends to disrupt the F ring, while Prometheus helps to keep the primary ring in place.
Pandora is about 25.3 miles (40.7 kilometers) in mean radius. It orbits 88,000 miles (142,000 kilometers) away from Saturn, near the F ring, taking 15.1 hours to go around Saturn.
 and dimensions of 122 x 119 x 93 miles (196 x 192 x 150 kilometers, respectively).
Janus is extensively cratered with several craters larger than 19 miles (30 kilometers). Janus' prominent craters are named Castor, Phoebe, Idas and Lynceus.
This oblong moon orbits 94,000 miles (151,000 kilometers) away from Saturn, taking 17 hours to complete one orbit, in the gap between the F and G rings, but it doesn't do this alone. It actually shares its orbit with a sister moon named Epimetheus, in what is called a co-orbital condition or 1:1 resonance.
One moon orbits 31 miles (50 km) farther away from the planet than the other, taking more time to complete one turn around Saturn. This slight difference means the inner, faster moving moon starts to catch up to the other approximately every four Earth years. Interestingly, when this happens, the gravity interaction between the moons causes them to trade places between these inner and outer orbits. The closest they get is about 6,200 miles (15,000 km). This is the only such orbital configuration known in the solar system.")
Alt...
Shadows darken parts of some of Janus' large craters as Cassini takes a close look during its flyby of this Saturnian moon on March 27, 2012.
NASA/JPL-Caltech/Space Science Institute
Janus
is a potato-shaped moon with a mean radius of 55.6 miles (89.5 kilometers) and dimensions of 122 x 119 x 93 miles (196 x 192 x 150 kilometers, respectively).
Janus is extensively cratered with several craters larger than 19 miles (30 kilometers). Janus' prominent craters are named Castor, Phoebe, Idas and Lynceus.
This oblong moon orbits 94,000 miles (151,000 kilometers) away from Saturn, taking 17 hours to complete one orbit, in the gap between the F and G rings, but it doesn't do this alone. It actually shares its orbit with a sister moon named Epimetheus, in what is called a co-orbital condition or 1:1 resonance.
One moon orbits 31 miles (50 km) farther away from the planet than the other, taking more time to complete one turn around Saturn. This slight difference means the inner, faster moving moon starts to catch up to the other approximately every four Earth years. Interestingly, when this happens, the gravity interaction between the moons causes them to trade places between these inner and outer orbits. The closest they get is about 6,200 miles (15,000 km). This is the only such orbital configuration known in the solar system.
![NASA's Cassini spacecraft captured this view of Saturn's moon Epimetheus (116 kilometers, or 72 miles across) during a moderately close flyby on Dec. 6, 2015.
NASA/JPL-Caltech/Space Science Institute
Epimetheus
is a potato-shaped moon with a mean radius of 36 miles (58 km) and dimensions of 84 x 65 x 65 miles (135 x 108 x 105 km, respectively). Its shape reflects pronounced flattening at the Epimethean South Pole associated with the remains of a large crater. Epimetheus has several craters larger than 19 miles (30 km), including Hilairea and Pollux.
This oblong moon orbits 94,000 miles (151,000 km) away from Saturn, taking 17 hours to circle the planet, in the gap between the F and G rings, but it doesn't do this alone. It actually shares its orbit with a sister moon named Janus, in what is called a co-orbital condition or 1:1 resonance.
[...]
Epimetheus and Janus
may have formed by the break-up of one moon. If so, it would have happened early in the life of the Saturn system since both moons have ancient cratered surfaces, many with soft edges because of dust. They also have some grooves (similar to grooves on the Martian moon Phobos) suggesting some glancing blows from other bodies. Together, the moons trail enough particles to generate a faint ring. However, except for very powerful telescopes, the region of their common orbit appears as a gap between Saturn's prominent F and G rings.](https://files.defcon.social/dcsocial-s3/media_attachments/files/115/593/118/324/033/823/original/851a53b00ec3e84e.jpg "NASA's Cassini spacecraft captured this view of Saturn's moon Epimetheus (116 kilometers, or 72 miles across) during a moderately close flyby on Dec. 6, 2015.
NASA/JPL-Caltech/Space Science Institute
Epimetheus
is a potato-shaped moon with a mean radius of 36 miles (58 km) and dimensions of 84 x 65 x 65 miles (135 x 108 x 105 km, respectively). Its shape reflects pronounced flattening at the Epimethean South Pole associated with the remains of a large crater. Epimetheus has several craters larger than 19 miles (30 km), including Hilairea and Pollux.
This oblong moon orbits 94,000 miles (151,000 km) away from Saturn, taking 17 hours to circle the planet, in the gap between the F and G rings, but it doesn't do this alone. It actually shares its orbit with a sister moon named Janus, in what is called a co-orbital condition or 1:1 resonance.
[...]
Epimetheus and Janus
may have formed by the break-up of one moon. If so, it would have happened early in the life of the Saturn system since both moons have ancient cratered surfaces, many with soft edges because of dust. They also have some grooves (similar to grooves on the Martian moon Phobos) suggesting some glancing blows from other bodies. Together, the moons trail enough particles to generate a faint ring. However, except for very powerful telescopes, the region of their common orbit appears as a gap between Saturn's prominent F and G rings.")
Alt...
NASA's Cassini spacecraft captured this view of Saturn's moon Epimetheus (116 kilometers, or 72 miles across) during a moderately close flyby on Dec. 6, 2015.
NASA/JPL-Caltech/Space Science Institute
Epimetheus
is a potato-shaped moon with a mean radius of 36 miles (58 km) and dimensions of 84 x 65 x 65 miles (135 x 108 x 105 km, respectively). Its shape reflects pronounced flattening at the Epimethean South Pole associated with the remains of a large crater. Epimetheus has several craters larger than 19 miles (30 km), including Hilairea and Pollux.
This oblong moon orbits 94,000 miles (151,000 km) away from Saturn, taking 17 hours to circle the planet, in the gap between the F and G rings, but it doesn't do this alone. It actually shares its orbit with a sister moon named Janus, in what is called a co-orbital condition or 1:1 resonance.
[...]
Epimetheus and Janus
may have formed by the break-up of one moon. If so, it would have happened early in the life of the Saturn system since both moons have ancient cratered surfaces, many with soft edges because of dust. They also have some grooves (similar to grooves on the Martian moon Phobos) suggesting some glancing blows from other bodies. Together, the moons trail enough particles to generate a faint ring. However, except for very powerful telescopes, the region of their common orbit appears as a gap between Saturn's prominent F and G rings.
. It is not quite big enough to hold a round shape, so it is somewhat ovoid with dimensions of 129 x 122 x 119 miles (207 x 197 x 191 kilometers, respectively). Its low density suggests that it consists almost entirely of water ice, which is the only substance ever detected on Mimas.
At a mean distance just over 115,000 miles (186,000 kilometers) from the massive planet, Mimas takes only 22 hours and 36 minutes to complete an orbit. Mimas is tidally locked: it keeps the same face toward Saturn as it flies around the planet, just as our Moon does with Earth.
Most of the Mimas surface is saturated with impact craters ranging in size up to greater than 25 miles (40 kilometers) in diameter. However, the craters in the South Pole region of Mimas are generally 12.4 miles (20 kilometers) in diameter or less. This suggests that some melting or other resurfacing processes occurred there later than on the rest of the moon. (Interestingly, the South Pole area of Enceladus appears to be the source of that moon's geysers.)
Its most distinguishing feature is a giant impact crater – named Herschel after the moon's discoverer ...")
Alt...
NASA's Cassini spacecraft spotted Saturn's moon Mimas and its large Herschel Crater. The crater looks somewhat like an eye peering out into space.
NASA/JPL/Space Science Institute
Crater-covered Mimas is the smallest and innermost of Saturn's major moons. It has a mean diameter of about 245 miles (394 kilometers). It is not quite big enough to hold a round shape, so it is somewhat ovoid with dimensions of 129 x 122 x 119 miles (207 x 197 x 191 kilometers, respectively). Its low density suggests that it consists almost entirely of water ice, which is the only substance ever detected on Mimas.
At a mean distance just over 115,000 miles (186,000 kilometers) from the massive planet, Mimas takes only 22 hours and 36 minutes to complete an orbit. Mimas is tidally locked: it keeps the same face toward Saturn as it flies around the planet, just as our Moon does with Earth.
Most of the Mimas surface is saturated with impact craters ranging in size up to greater than 25 miles (40 kilometers) in diameter. However, the craters in the South Pole region of Mimas are generally 12.4 miles (20 kilometers) in diameter or less. This suggests that some melting or other resurfacing processes occurred there later than on the rest of the moon. (Interestingly, the South Pole area of Enceladus appears to be the source of that moon's geysers.)
Its most distinguishing feature is a giant impact crater – named Herschel after the moon's discoverer ...
Saturn Moons
The Saturn system teems with natural satellites, from planet-sized Titan to small oddballs, shaped like potatoes or ravioli.
more about:
+ Titan
https://science.nasa.gov/saturn/moons/titan/facts/
+ Enceladus
https://science.nasa.gov/saturn/moons/enceladus/
+ Hyperion
https://science.nasa.gov/saturn/moons/enceladus/
+ Prometheus
https://science.nasa.gov/saturn/moons/prometheus/
Please read the ALT-Texts for short overviews.
#space #saturn #astrophotography #photography #science #astronomy #physics #nature #NASA #ESA #education
, and is nearly 50 percent wider than Earth’s moon. Titan is about 759,000 miles (1.2 million kilometers) from Saturn, which itself is about 886 million miles (1.4 billion kilometers) from the Sun, or about 9.5 astronomical units (AU). One AU is the distance from Earth to the Sun. Light from the Sun takes about 80 minutes to reach Titan; because of the distance, sunlight is about 100 times fainter at Saturn and Titan than at Earth.")
Alt...
Titan passes in front of Saturn in this image from NASA's Cassini spacecraft.
NASA/JPL-Caltech/Space Science Institute
Titan
has a radius of about 1,600 miles (2,575 kilometers), and is nearly 50 percent wider than Earth’s moon. Titan is about 759,000 miles (1.2 million kilometers) from Saturn, which itself is about 886 million miles (1.4 billion kilometers) from the Sun, or about 9.5 astronomical units (AU). One AU is the distance from Earth to the Sun. Light from the Sun takes about 80 minutes to reach Titan; because of the distance, sunlight is about 100 times fainter at Saturn and Titan than at Earth.
 of the surface of Enceladus.
NASA/JPL/Space Science Institute
Enceladus
orbits Saturn at a distance of 148,000 miles (238,000 kilometers) between the orbits of two other moons, Mimas and Tethys. Enceladus is tidally locked with Saturn, keeping the same face toward the planet. It completes one orbit every 32.9 hours within the densest part of Saturn's E Ring. Also, like some other moons in the extensive systems of the giant planets, Enceladus is trapped in what’s called an orbital resonance, which is when two or more moons line up with their parent planet at regular intervals and interact gravitationally. Enceladus orbits Saturn twice every time Dione, a larger moon, orbits once. Dione’s gravity stretches Enceladus’ orbit into an elliptical shape, so Enceladus is sometimes closer and other times farther from Saturn, causing tidal heating within the moon.
Parts of Enceladus show craters up to 22 miles (35 kilometers) in diameter, while other regions have few craters, indicating major resurfacing events in the geologically recent past. In particular, the south polar region of Enceladus is almost entirely free of impact craters. The area is also littered with house-sized ice boulders and regions carved by tectonic patterns unique to this region of the moon.")
Alt...
This mosaic of Saturn's moon Enceladus was created with images captured by NASA's Cassini spacecraft on Oct. 9, 2008, after the spacecraft came within about 16 miles (25 kilometers) of the surface of Enceladus.
NASA/JPL/Space Science Institute
Enceladus
orbits Saturn at a distance of 148,000 miles (238,000 kilometers) between the orbits of two other moons, Mimas and Tethys. Enceladus is tidally locked with Saturn, keeping the same face toward the planet. It completes one orbit every 32.9 hours within the densest part of Saturn's E Ring. Also, like some other moons in the extensive systems of the giant planets, Enceladus is trapped in what’s called an orbital resonance, which is when two or more moons line up with their parent planet at regular intervals and interact gravitationally. Enceladus orbits Saturn twice every time Dione, a larger moon, orbits once. Dione’s gravity stretches Enceladus’ orbit into an elliptical shape, so Enceladus is sometimes closer and other times farther from Saturn, causing tidal heating within the moon.
Parts of Enceladus show craters up to 22 miles (35 kilometers) in diameter, while other regions have few craters, indicating major resurfacing events in the geologically recent past. In particular, the south polar region of Enceladus is almost entirely free of impact craters. The area is also littered with house-sized ice boulders and regions carved by tectonic patterns unique to this region of the moon.
 from Saturn in an eccentric orbit. This contributes to variations in the spin or rotation of Hyperion. A stronger effect on Hyperion's rotation is that it is in resonance with Saturn's largest moon, Titan, which orbits at 759,200 miles (1,221,850 kilometers). Thus, the two objects speed up and slow down as they pass each other in a complex set of variations. Because Hyperion is much smaller than Titan, its rotation and orbit are affected vastly more than the larger moon, and Titan apparently keeps the Hyperion orbit eccentric rather than growing more circular over time.
The great distance from Saturn and resonance with Titan has also kept Hyperion from becoming tidally locked facing Saturn. Hyperion rotates roughly every 13 days during its 21-day orbit.")
Alt...
This stunning false-color view of Saturn's moon Hyperion reveals crisp details across the strange, tumbling moon's surface. Differences in color could represent differences in the composition of surface materials. The view was obtained during Cassini's close flyby on Sept. 26, 2005.
NASA/JPL-Caltech/Space Science Institute
Hyperion
rotates chaotically, tumbling unpredictably through space as it orbits Saturn. Hyperion orbits at a mean distance of 933,000 miles (1,500,000 kilometers) from Saturn in an eccentric orbit. This contributes to variations in the spin or rotation of Hyperion. A stronger effect on Hyperion's rotation is that it is in resonance with Saturn's largest moon, Titan, which orbits at 759,200 miles (1,221,850 kilometers). Thus, the two objects speed up and slow down as they pass each other in a complex set of variations. Because Hyperion is much smaller than Titan, its rotation and orbit are affected vastly more than the larger moon, and Titan apparently keeps the Hyperion orbit eccentric rather than growing more circular over time.
The great distance from Saturn and resonance with Titan has also kept Hyperion from becoming tidally locked facing Saturn. Hyperion rotates roughly every 13 days during its 21-day orbit.
 during a moderately close flyby on Dec. 6, 2015.
NASA/JPL-Caltech/Space Science Institute
Prometheus
acts as a shepherding moon, constraining the extent of the inner edge of Saturn's F Ring. Prometheus is extremely irregular and has visible craters — some up to 12.4 miles (20 kilometers) in diameter. However, it is much less cratered than its nearby neighbors Pandora, Janus and Epimetheus. The density of Prometheus has been estimated to be low; it is probably a porous, icy body.
The potato-shaped moon is about 26.8 miles (43.1 kilometers) in mean radius, orbiting Saturn at a distance of 87,000 miles (139,000 kilometers), taking 14.7 hours to go around the planet.")
Alt...
NASA's Cassini spacecraft spied details on the pockmarked surface of Saturn's moon Prometheus (86 kilometers, or 53 miles across) during a moderately close flyby on Dec. 6, 2015.
NASA/JPL-Caltech/Space Science Institute
Prometheus
acts as a shepherding moon, constraining the extent of the inner edge of Saturn's F Ring. Prometheus is extremely irregular and has visible craters — some up to 12.4 miles (20 kilometers) in diameter. However, it is much less cratered than its nearby neighbors Pandora, Janus and Epimetheus. The density of Prometheus has been estimated to be low; it is probably a porous, icy body.
The potato-shaped moon is about 26.8 miles (43.1 kilometers) in mean radius, orbiting Saturn at a distance of 87,000 miles (139,000 kilometers), taking 14.7 hours to go around the planet.