Search results for tag #astronomy
![[?]](https://files.defcon.social/dcsocial-s3/accounts/avatars/113/208/344/507/078/943/original/014820ad22daee1c.jpg)
2025 November 26
Globular Cluster M15 Deep Field
* Image Credit & Copyright: Alvaro Ibanez Perez
https://aipastroimaging.com/sobre-mi/
Explanation:
Stars, like bees, swarm around the center of bright globular cluster M15. The central ball of over 100,000 stars is a relic from the early years of our Galaxy, and continues to orbit the Milky Way's center. M15, one of about 150 globular clusters remaining, is noted for being easily visible with only binoculars, having at its center one of the densest concentrations of stars known, and containing a high abundance of variable stars and pulsars. The featured image of M15 was taken by combining very long exposures -- 122 hours in all -- and so brings up faint wisps of gas and dust in front of the giant ball of stars. M15 lies about 35,000 light years away toward the constellation of the Winged Horse (Pegasus).
https://science.nasa.gov/universe/stars/
https://apod.nasa.gov/apod/ap980719.html
https://science.nasa.gov/resource/the-milky-way-galaxy/
https://apod.nasa.gov/apod/ap241124.html
https://www.youtube.com/watch?v=hmN7Rj2ns3M
https://en.wikipedia.org/wiki/Globular_cluster
https://apod.nasa.gov/apod/ap000804.html
https://apod.nasa.gov/apod/ap070415.html
https://svs.gsfc.nasa.gov/10144
https://en.wikipedia.org/wiki/Integrated_Flux_Nebula
https://apod.nasa.gov/apod/ap190328.html
https://spaceplace.nasa.gov/constellations/en/
https://en.wikipedia.org/wiki/Pegasus_(constellation)
https://apod.nasa.gov/apod/ap251126.html
#space #cluster #astrophotography #photography #science #astronomy #physics #nature #NASA #apod
.
Authors & editors: Robert Nemiroff (MTU) & Jerry Bonnell (UMCP)
NASA Official: Amber Straughn Specific rights apply.
NASA Web Privacy, Accessibility, Notices;
A service of: ASD at NASA / GSFC,
NASA Science Activation
& Michigan Tech. U.")
Alt...
2025 November 26
A starfield is shown with thin wisps of gray and red running through it. In the center is an usual ball -- which is a globular cluster of stars upon closer inspection.
Globular Cluster M15 Deep Field
* Image Credit & Copyright: Alvaro Ibanez Perez
Explanation:
Stars, like bees, swarm around the center of bright globular cluster M15. The central ball of over 100,000 stars is a relic from the early years of our Galaxy, and continues to orbit the Milky Way's center. M15, one of about 150 globular clusters remaining, is noted for being easily visible with only binoculars, having at its center one of the densest concentrations of stars known, and containing a high abundance of variable stars and pulsars. The featured image of M15 was taken by combining very long exposures -- 122 hours in all -- and so brings up faint wisps of gas and dust in front of the giant ball of stars. M15 lies about 35,000 light years away toward the constellation of the Winged Horse (Pegasus).
Authors & editors: Robert Nemiroff (MTU) & Jerry Bonnell (UMCP)
NASA Official: Amber Straughn Specific rights apply.
NASA Web Privacy, Accessibility, Notices;
A service of: ASD at NASA / GSFC,
NASA Science Activation
& Michigan Tech. U.
When few people in Einstein's time dealt with the theory of relativity, they were probably initially considered heretical cranks. After that came a time when this theory was considered proven, but very few could imagine it. Only for a very short time have we been able to see that gravity/mass bends space, at least visually, only with appropriately modern technical aids. As "normal" people, we assume that when we look ahead and see what is coming our way, we look a little into the future, because we imagine that the visitor on the horizon wants to come to us and we may soon drink coffee or tea together.
Modern man has only recently been able to accept that the further we look into space, the further we look into the past. And only a little longer we think that the earth is not a disc from which we can fall down into nothingness ..
It is all too human to hold on to old habits, views and narrow concepts.
If we look at some of the previous advanced civilizations, we sometimes have to admit that they were probably able to throw off their habitual ballast faster than we can. For this reason, some were centuries ahead of their time.
Maybe this has nothing to do with earlier advanced civilizations or certain centuries, but with the fact that people with as unfiltered and free a spirit as possible are far ahead of the respective zeitgeist?
Einstein and his colleagues, if I see it correctly, were almost exactly a century ahead of us. I am very excited to see what our free spirits will get out of the technical possibilities that exist today and the resulting knowledge and look forward to the upcoming squad of "weirdos"
2025 November 25
Comet Lemmon and the Milky Way
* Image Credit & Copyright: Lin Zixuan (Tsinghua U.)
https://www.tsinghua.edu.cn/en/
Explanation:
What did Comet Lemmon look like when it was at its best? One example is pictured here, featuring three celestial spectacles all at different distances. The closest spectacle is the snowcapped Meili Mountains, part of the Himalayas in China. The middle marvel is Comet Lemmon near its picturesque best early this month, showing not only a white dust tail trailing off to the right but its blue solar wind-distorted ion tail trailing off to the left. Far in the distance on the left is the magnificent central plane of our Milky Way Galaxy, featuring dark dust, red nebula, and including billions of Sun-like stars. Comet C/2025 A6 (Lemmon) is already fading as it heads back into the outer Solar System, while the Himalayan mountains will gradually erode over the next billion years. The Milky Way Galaxy, though, will live on -- forming new mountains and comets -- for many billions of years into the future.
https://www.youtube.com/watch?v=YylNkfmGNAQ
https://en.wikipedia.org/wiki/Himalayas
https://apod.nasa.gov/apod/ap251117.html
https://astronomy.swin.edu.au/cosmos/C/cometary+dust+tail
https://apod.nasa.gov/apod/ap240326.html
https://science.nasa.gov/resource/the-milky-way-galaxy/
https://apod.nasa.gov/apod/ap051004.html
https://apod.nasa.gov/apod/ap240214.html
https://science.nasa.gov/sun/
https://en.wikipedia.org/wiki/C/2025_A6_(Lemmon)
https://www.pbs.org/wgbh/nova/everest/earth/birth.html
https://apod.nasa.gov/apod/ap241105.html
https://apod.nasa.gov/apod/ap210303.html
https://apod.nasa.gov/apod/ap251125.html
#space #comets #astrophotography #photography #science #astronomy #nature #NASA #ESA #education #apod

Explanation:
What did Comet Lemmon look like when it was at its best? One example is pictured here, featuring three celestial spectacles all at different distances. The closest spectacle is the snowcapped Meili Mountains, part of the Himalayas in China. The middle marvel is Comet Lemmon near its picturesque best early this month, showing not only a white dust tail trailing off to the right but its blue solar wind-distorted ion tail trailing off to the left. Far in the distance on the left is the magnificent central plane of our Milky Way Galaxy, featuring dark dust, red nebula, and including billions of Sun-like stars. Comet C/2025 A6 (Lemmon) is already fading as it heads back into the outer Solar System, while the Himalayan mountains will gradually erode over the next billion years. The Milky Way Galaxy, though, will live on -- forming new mountains and comets -- for many billions of years into the future.
Authors & editors: Robert Nemiroff (MTU) & Jerry Bonnell (UMCP)
NASA Official: Amber Straughn Specific rights apply.")
Alt...
2025 November 25
A night skyscape is shown over snowcapped mountains. On the left is the band of the Milky Way Galaxy, while on the right is a bright comet with two tails -- a white tail going up and trailing to the right and a longer blue tail going up and trailing off to the left.
Comet Lemmon and the Milky Way
* Image Credit & Copyright: Lin Zixuan (Tsinghua U.)
Explanation:
What did Comet Lemmon look like when it was at its best? One example is pictured here, featuring three celestial spectacles all at different distances. The closest spectacle is the snowcapped Meili Mountains, part of the Himalayas in China. The middle marvel is Comet Lemmon near its picturesque best early this month, showing not only a white dust tail trailing off to the right but its blue solar wind-distorted ion tail trailing off to the left. Far in the distance on the left is the magnificent central plane of our Milky Way Galaxy, featuring dark dust, red nebula, and including billions of Sun-like stars. Comet C/2025 A6 (Lemmon) is already fading as it heads back into the outer Solar System, while the Himalayan mountains will gradually erode over the next billion years. The Milky Way Galaxy, though, will live on -- forming new mountains and comets -- for many billions of years into the future.
Authors & editors: Robert Nemiroff (MTU) & Jerry Bonnell (UMCP)
NASA Official: Amber Straughn Specific rights apply.
Wolf-Rayet Apep Visualization — James Webb Space Telescope
This scientific visualization models what three of the four dust shells sent out by two Wolf-Rayet stars in the Apep system look like in 3D based on mid-infrared observations from NASA’s James Webb Space Telescope. Apep is made up of two Wolf-Rayet binary stars that are orbiting together with a third supergiant star. For 25 years during every 190-year orbit, the Wolf-Rayet stars’ winds collide, producing and sending out new waves of amorphous carbon dust. The width of the widest bubble is at least 4.6 light-years across.
Credit:
Video: NASA, ESA, CSA, STScI
Simulation: Yinuo Han (CALTECH), Ryan White (Macquarie University)
Image processing: Alyssa Pagan (STScI)
Visualization: Christian Nieves (STScI)
#space #nebula #astrophotography #photography #science #astronomy #physics #nature #NASA #ESA #APOD
2025 November 24
Apep: Unusual Dust Shells from Webb
* Image Credit: NASA, ESA, CSA, STScI, JWST
https://www.nasa.gov/
https://www.esa.int/
https://www.asc-csa.gc.ca/eng/
https://www.stsci.edu/
https://science.nasa.gov/mission/webb/about-overview/
* Science: Y. Han (Caltech), R. White (Macquarie U.)
https://www.gps.caltech.edu/people/yinuo-han
https://www.gps.caltech.edu/
https://researchers.mq.edu.au/en/persons/ryan-white/
https://www.mq.edu.au/
* Image Processing: A. Pagan (STScI)
https://www.linkedin.com/in/alyssa-pagan-058170144
Explanation:
What created this unusual space sculpture? Stars. This unusual system of swirls and shells, known as Apep, was observed in unprecedented detail by NASA’s James Webb Space Telescope in infrared light in 2024. Observations indicate that the unusual shape originates from two massive Wolf-Rayet stars orbiting each other every 190 years with each close passes causing a new shell of dust and gas to be expelled. Holes in these shells are thought to be caused by a third orbiting star. This stellar dust dance will likely continue for hundreds of thousands of years, possibly ending only when one of the massive stars runs out of internal nuclear fuel and explodes in a supernova punctuated by a burst of gamma-rays.
https://science.nasa.gov/asset/webb/wolf-rayet-apep-miri-image/
https://apod.nasa.gov/apod/ap250129.html
https://en.wikipedia.org/wiki/List_of_most_massive_stars
https://en.wikipedia.org/wiki/Apep_(star_system)
https://science.nasa.gov/universe/stars/
https://science.nasa.gov/ems/07_infraredwaves/
https://science.nasa.gov/mission/webb/
https://www.nsf.gov/news/all-we-are-dust-interstellar-wind
https://apod.nasa.gov/apod/ap200304.html
https://www.youtube.com/watch?v=wymMn-SmALYhttps://www.youtube.com/watch?v=wymMn-SmALY
https://science.nasa.gov/universe/gamma-ray-bursts-harvesting-knowledge-from-the-universes-most-powerful-explosions/
https://apod.nasa.gov/apod/ap251124.html
#space #nebula #astrophotography #photography #science #astronomy #physics #nature #NASA #ESA #apod
, R. White (Macquarie U.)
* Image Processing: A. Pagan (STScI)
Explanation:
What created this unusual space sculpture? Stars. This unusual system of swirls and shells, known as Apep, was observed in unprecedented detail by NASA’s James Webb Space Telescope in infrared light in 2024. Observations indicate that the unusual shape originates from two massive Wolf-Rayet stars orbiting each other every 190 years with each close passes causing a new shell of dust and gas to be expelled. Holes in these shells are thought to be caused by a third orbiting star. This stellar dust dance will likely continue for hundreds of thousands of years, possibly ending only when one of the massive stars runs out of internal nuclear fuel and explodes in a supernova punctuated by a burst of gamma-rays.
Authors & editors: Robert Nemiroff (MTU) & Jerry Bonnell (UMCP)
NASA Official: Amber Straughn Specific rights apply.
NASA Web Privacy, Accessibility, Notices;
A service of: ASD at NASA / GSFC,
NASA Science Activation
& Michigan Tech. U.")
Alt...
2025 November 24
A starfield has a large and unusual red and orange nebula in the middle. The nebula seems to contain not only swirls but also nearly transparent shells.
Apep: Unusual Dust Shells from Webb
* Image Credit: NASA, ESA, CSA, STScI, JWST
* Science: Y. Han (Caltech), R. White (Macquarie U.)
* Image Processing: A. Pagan (STScI)
Explanation:
What created this unusual space sculpture? Stars. This unusual system of swirls and shells, known as Apep, was observed in unprecedented detail by NASA’s James Webb Space Telescope in infrared light in 2024. Observations indicate that the unusual shape originates from two massive Wolf-Rayet stars orbiting each other every 190 years with each close passes causing a new shell of dust and gas to be expelled. Holes in these shells are thought to be caused by a third orbiting star. This stellar dust dance will likely continue for hundreds of thousands of years, possibly ending only when one of the massive stars runs out of internal nuclear fuel and explodes in a supernova punctuated by a burst of gamma-rays.
Authors & editors: Robert Nemiroff (MTU) & Jerry Bonnell (UMCP)
NASA Official: Amber Straughn Specific rights apply.
NASA Web Privacy, Accessibility, Notices;
A service of: ASD at NASA / GSFC,
NASA Science Activation
& Michigan Tech. U.
2025 November 23
The Observable Universe
* Illustration Credit & Licence: Wikipedia, Pablo Carlos Budassi
https://commons.wikimedia.org/wiki/User:Unmismoobjetivo
https://pablocarlosbudassi.com/
Explanation:
How far can you see? Everything you can see, and everything you could possibly see, right now, assuming your eyes could detect all types of radiations around you -- is the observable universe. In light, the farthest we can see comes from the cosmic microwave background, a time 13.8 billion years ago when the universe was opaque like thick fog. Some neutrinos and gravitational waves that surround us come from even farther out, but humanity does not yet have the technology to detect them. The featured image illustrates the observable universe on an increasingly compact scale, with the Earth and Sun at the center surrounded by our Solar System, nearby stars, nearby galaxies, distant galaxies, filaments of early matter, and the cosmic microwave background. Cosmologists typically assume that our observable universe is just the nearby part of a greater entity known as "the universe" where the same physics applies. However, there are several lines of popular but speculative reasoning that assert that even our universe is part of a greater multiverse where either different physical constants occur, different physical laws apply, higher dimensions operate, or slightly different-by-chance versions of our standard universe exist.
https://en.wikipedia.org/wiki/Observable_universe
https://science.nasa.gov/mission/wmap/
https://en.wikipedia.org/wiki/Age_of_the_universe
https://icecube.wisc.edu/outreach/neutrinos/
https://www.ligo.caltech.edu/page/what-are-gw
https://en.wikipedia.org/wiki/Logarhttps://apod.nasa.gov/apod/ap180722.htmlithmic_scale
https://science.nasa.gov/solar-system/solar-system-facts/
http://www.atlasoftheuniverse.com/12lys.html
https://apod.nasa.gov/apod/ap110614.html
https://apod.nasa.gov/apod/ap250302.html
https://apod.nasa.gov/apod/ap231231.html
https://science.nasa.gov/astrophysics/science-questions/how-do-matter-energy-space-and-time-behave-under-the-extraordinarily-diverse-conditions-of-the-cosmos/
https://asterisk.apod.com/viewtopic.php?f=39&t=21958
https://en.wikipedia.org/wiki/Multiverse
https://apod.nasa.gov/apod/ap170401.html
https://medium.com/starts-with-a-bang/ask-ethan-96-is-the-multiverse-science-ecceb24fa2af
https://www.pbs.org/wgbh/nova/article/how-many-dimensions-does-the-universe-really-have/
https://apod.nasa.gov/apod/fap/ap251123.html
#space #universe #map #astronomy #astrophotography #photography #science #physics #NASA #apod

Alt...
Artist's logarithmic scale conception of the observable universe with the Solar System at the center, inner and outer planets, Kuiper belt, Oort cloud, Alpha Centauri, Perseus Arm, Milky Way galaxy, Andromeda galaxy, nearby galaxies, Cosmic Web, Cosmic microwave radiation and Big Bang's invisible plasma on the edge.
Created specially for Wikipedia.org by Pablo Carlos Budassi. Please mention original author's name along with each image copy you use. Suggestions for making this illustration more accurate and descriptions on other languages are welcome.
The Celestial Zoo' poster 👉 https://bit.ly/celestialzoo
A circular plot that shows in detail astronomical objects of various distances and sizes thanks to the use of a logarithmic scale. The solar system is located in the center. Towards the edges, the scale is progressively reduced to show in detail the most distant and biggest structures of the observable universe sphere.
A high-resolution download: https://payhip.com/b/ZWy5S
Quality metal plate: https://displate.com/artist/pablocarlosbudassi/maps-of-the-universe
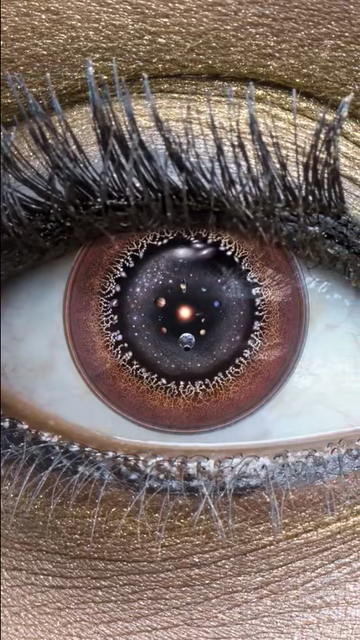
Many things are commented on this image. Most people say it’s the eye of the universe looking back at us, making us feel small and humble, or maybe making us feel great and lucky. Lucky to be able to stare at the cosmic beauty. With a bone-deep certainty that in all this diversity we cannot be the only ones!
https://pablocarlosbudassi.com/2021/02/the-infographic-and-artistic-work-named.html
#space #universe #map #astronomy #astrophotography #photography #science #nature #NASA #ESA
Alt...
Many things are commented on this image. Most people say it’s the eye of the universe looking back at us, making us feel small and humble, or maybe making us feel great and lucky. Lucky to be able to stare at the cosmic beauty. With a bone-deep certainty that in all this diversity we cannot be the only ones!
TOPIC> As Far As We Can See
2022 March 16
The Observable Universe
* Illustration Credit & Licence: Wikipedia, Pablo Carlos Budassi
https://commons.wikimedia.org/wiki/User:Unmismoobjetivo
https://commons.wikimedia.org/wiki/File:Extended_universe_logarithmic_illustration_(English_annotated).png
Explanation:
How far can you see? Everything you can see, and everything you could possibly see, right now, assuming your eyes could detect all types of radiations around you -- is the observable universe. In light, the farthest we can see comes from the cosmic microwave background, a time 13.8 billion years ago when the universe was opaque like thick fog. Some neutrinos and gravitational waves that surround us come from even farther out, but humanity does not yet have the technology to detect them. The featured image illustrates the observable universe on an increasingly compact scale, with the Earth and Sun at the center surrounded by our Solar System, nearby stars, nearby galaxies, distant galaxies, filaments of early matter, and the cosmic microwave background. Cosmologists typically assume that our observable universe is just the nearby part of a greater entity known as "the universe" where the same physics applies. However, there are several lines of popular but speculative reasoning that assert that even our universe is part of a greater multiverse where either different physical constants occur, different physical laws apply, higher dimensions operate, or slightly different-by-chance versions of our standard universe exist.
https://en.wikipedia.org/wiki/Observable_universe
https://science.nasa.gov/astrophysics/science-questions/how-do-matter-energy-space-and-time-behave-under-the-extraordinarily-diverse-conditions-of-the-cosmos/
https://apod.nasa.gov/apod/ap180305.html
http://www.atlasoftheuniverse.com/12lys.html
https://science.nasa.gov/solar-system/solar-system-facts/
https://en.wikipedia.org/wiki/Age_of_the_universe
https://wmap.gsfc.nasa.gov/universe/bb_tests_cmb.html
https://en.wikipedia.org/wiki/Logarithmic_scale
Authors & editors: Robert Nemiroff (MTU) & Jerry Bonnell (UMCP)
NASA Official: Phillip Newman Specific rights apply.
#space #universe #map #astronomy #astrophotography #photography #science #nature #NASA #education

Alt...
2022 March 16
The featured illustration depicts the entire visible universe and representations of most of the notable objects in it.
The Observable Universe
* Illustration Credit & Licence: Wikipedia, Pablo Carlos Budassi
Explanation:
How far can you see? Everything you can see, and everything you could possibly see, right now, assuming your eyes could detect all types of radiations around you -- is the observable universe. In light, the farthest we can see comes from the cosmic microwave background, a time 13.8 billion years ago when the universe was opaque like thick fog. Some neutrinos and gravitational waves that surround us come from even farther out, but humanity does not yet have the technology to detect them. The featured image illustrates the observable universe on an increasingly compact scale, with the Earth and Sun at the center surrounded by our Solar System, nearby stars, nearby galaxies, distant galaxies, filaments of early matter, and the cosmic microwave background. Cosmologists typically assume that our observable universe is just the nearby part of a greater entity known as "the universe" where the same physics applies. However, there are several lines of popular but speculative reasoning that assert that even our universe is part of a greater multiverse where either different physical constants occur, different physical laws apply, higher dimensions operate, or slightly different-by-chance versions of our standard universe exist.
2013 March 25
Planck Maps the Microwave Background
* Image Credit: European Space Agency, Planck Collaboration
https://www.esa.int/
https://www.esa.int/Science_Exploration/Space_Science/Planck
Explanation:
What is our universe made of? To help find out, ESA launched the Planck satellite to map, in unprecedented detail, slight temperature differences on the oldest surface known -- the background sky left billions of years ago when our universe first became transparent to light. Visible in all directions, this cosmic microwave background is a complex tapestry that could only show the hot and cold patterns observed were the universe to be composed of specific types of energy that evolved in specific ways. The results, reported last week, confirm again that most of our universe is mostly composed of mysterious and unfamiliar dark energy, and that even most of the remaining matter energy is strangely dark. Additionally, Planck data impressively peg the age of the universe at about 13.81 billion years, slightly older than that estimated by various other means including NASA's WMAP satellite, and the expansion rate at 67.3 (+/- 1.2) km/sec/Mpc, slightly lower than previous estimates. Some features of the above sky map remain unknown, such as why the temperature fluctuations seem to be slightly greater on one half of the sky than the other.
https://apod.nasa.gov/apod/ap130325.html
#space #universe #map #astronomy #astrophotography #photography #science #nature #NASA #ESA #education
 km/sec/Mpc, slightly lower than previous estimates. Some features of the above sky map remain unknown, such as why the temperature fluctuations seem to be slightly greater on one half of the sky than the other.
Authors & editors: Robert Nemiroff (MTU) & Jerry Bonnell (UMCP)
NASA Official: Phillip Newman Specific rights apply.
NASA Web Privacy Policy and Important Notices
A service of: ASD at NASA / GSFC
& Michigan Tech. U.")
Alt...
2013 March 25
Planck Maps the Microwave Background
* Image Credit: European Space Agency, Planck Collaboration
Explanation:
What is our universe made of? To help find out, ESA launched the Planck satellite to map, in unprecedented detail, slight temperature differences on the oldest surface known -- the background sky left billions of years ago when our universe first became transparent to light. Visible in all directions, this cosmic microwave background is a complex tapestry that could only show the hot and cold patterns observed were the universe to be composed of specific types of energy that evolved in specific ways. The results, reported last week, confirm again that most of our universe is mostly composed of mysterious and unfamiliar dark energy, and that even most of the remaining matter energy is strangely dark. Additionally, Planck data impressively peg the age of the universe at about 13.81 billion years, slightly older than that estimated by various other means including NASA's WMAP satellite, and the expansion rate at 67.3 (+/- 1.2) km/sec/Mpc, slightly lower than previous estimates. Some features of the above sky map remain unknown, such as why the temperature fluctuations seem to be slightly greater on one half of the sky than the other.
Authors & editors: Robert Nemiroff (MTU) & Jerry Bonnell (UMCP)
NASA Official: Phillip Newman Specific rights apply.
NASA Web Privacy Policy and Important Notices
A service of: ASD at NASA / GSFC
& Michigan Tech. U.
Planck finds no new evidence for cosmic anomalies
Science & Exploration
06/06/2019
ESA’s Planck satellite has found no new evidence for the puzzling cosmic anomalies that appeared in its temperature map of the Universe. The latest study does not rule out the potential relevance of the anomalies but they do mean astronomers must work even harder to understand the origin of these puzzling features.
Planck’s latest results come from an analysis of the polarisation of the Cosmic Microwave Background (CMB) radiation – the most ancient light in cosmic history, released when the Universe was just 380 000 years old.
The satellite’s initial analysis, which was made public in 2013, concentrated on the temperature of this radiation across the sky. This allows astronomers to investigate the origin and evolution of the cosmos. While it mostly confirmed the standard picture of how our Universe evolves, Planck’s first map also revealed a number of anomalies that are difficult to explain within the standard model of cosmology.
The anomalies are faint features on the sky that appear at large angular scales. They are definitely not artefacts produced by the behaviour of the satellite or the data processing, but they are faint enough that they could be statistical flukes – fluctuations which are extremely rare but not entirely ruled out by the standard model.
Alternatively, the anomalies might be a sign of ‘new physics’, the term used for as-yet unrecognised natural processes that would extend the known laws of physics.
Read more:
>>> https://www.esa.int/Science_Exploration/Space_Science/Planck/Planck_finds_no_new_evidence_for_cosmic_anomalies
Credit:
ESA/Planck Science Exploration
#space #universe #map #astronomy #astrophotography #photography #science #nature #NASA #ESA #education
Alt...
Planck finds no new evidence for cosmic anomalies
Science & Exploration
06/06/2019
ESA’s Planck satellite has found no new evidence for the puzzling cosmic anomalies that appeared in its temperature map of the Universe. The latest study does not rule out the potential relevance of the anomalies but they do mean astronomers must work even harder to understand the origin of these puzzling features.
Planck’s latest results come from an analysis of the polarisation of the Cosmic Microwave Background (CMB) radiation – the most ancient light in cosmic history, released when the Universe was just 380 000 years old.
The satellite’s initial analysis, which was made public in 2013, concentrated on the temperature of this radiation across the sky. This allows astronomers to investigate the origin and evolution of the cosmos. While it mostly confirmed the standard picture of how our Universe evolves, Planck’s first map also revealed a number of anomalies that are difficult to explain within the standard model of cosmology.
The anomalies are faint features on the sky that appear at large angular scales. They are definitely not artefacts produced by the behaviour of the satellite or the data processing, but they are faint enough that they could be statistical flukes – fluctuations which are extremely rare but not entirely ruled out by the standard model.
Credit:
ESA/Planck Science Exploration

Alt...
..
The timeline in the upper part of the illustration shows an artistic view of the evolution of the cosmos on large scales. The processes depicted range from inflation, the brief era of accelerated expansion that the Universe underwent when it was a tiny fraction of a second old, to the release of the CMB, the oldest light in our Universe, imprinted on the sky when the cosmos was just 380 000 years old; and from the ‘Dark Ages’ to the birth of the first stars and galaxies, which reionised the Universe when it was a few hundred million years old, all the way to the present time.
Tiny quantum fluctuations generated during the inflationary epoch are the seeds of future structure: the stars and galaxies of today. After the end of inflation, dark matter particles started to clump around these cosmic seeds, slowly building a cosmic web of structures. Later, after the release of the CMB, normal matter started to fall into these structures, eventually giving rise to stars and galaxies.
The inserts below show a zoomed-in view on some of the microscopic processes taking place during cosmic history: from the tiny fluctuations generated during inflation, to the dense soup of light and particles that filled the early Universe; from the last scattering of light off electrons, which gave rise to the CMB and its polarisation, to the reionisation of the Universe, caused by the first stars and galaxies, which induced additional polarisation on the CMB.
 polarization amplitude as observed by ESA’s Planck satellite. While fluctuations in the CMB are present and were observed by Planck down to very small angular scales, these images have been filtered to show mostly the signal detected on fairly large scales in the sky, around 5 degrees – as a comparison, the full Moon spans about half a degree.
On these large scales, a number of anomalies are observed in the CMB temperature – these are features that are difficult to explain within the standard model of cosmology, which relies on the assumption that the Universe, on large scales, has the same properties when observed in all directions.
The most serious anomaly is a deficit in the signal observed on scales around 5 degrees, which is about ten per cent weaker than predicted. Other anomalous traits are a significant discrepancy of the signal as observed in the two opposite hemispheres of the sky and a so-called 'cold spot' – a large, low-temperature spot with an unusually steep temperature profile (the location of this spot is also outlined in the lower right).
A comparison between the top map, showing the total Planck measurement – comprising both signal and noise – with the bottom map, showing only the noise, indicates that some anomalous features may be present, such as for example a power asymmetry between the two hemispheres, but they are statistically unconvincing.")
Alt...
Map of the cosmic microwave background (CMB) polarization amplitude as observed by ESA’s Planck satellite. While fluctuations in the CMB are present and were observed by Planck down to very small angular scales, these images have been filtered to show mostly the signal detected on fairly large scales in the sky, around 5 degrees – as a comparison, the full Moon spans about half a degree.
On these large scales, a number of anomalies are observed in the CMB temperature – these are features that are difficult to explain within the standard model of cosmology, which relies on the assumption that the Universe, on large scales, has the same properties when observed in all directions.
The most serious anomaly is a deficit in the signal observed on scales around 5 degrees, which is about ten per cent weaker than predicted. Other anomalous traits are a significant discrepancy of the signal as observed in the two opposite hemispheres of the sky and a so-called 'cold spot' – a large, low-temperature spot with an unusually steep temperature profile (the location of this spot is also outlined in the lower right).
A comparison between the top map, showing the total Planck measurement – comprising both signal and noise – with the bottom map, showing only the noise, indicates that some anomalous features may be present, such as for example a power asymmetry between the two hemispheres, but they are statistically unconvincing.
 temperature as observed by ESA’s Planck satellite. While fluctuations in the CMB are present and were observed by Planck down to very small angular scales, these images have been filtered to show mostly the signal detected on fairly large scales in the sky, around 5 degrees and larger – as a comparison, the full Moon spans about half a degree.
On these large scales, a number of anomalies are observed in the CMB temperature – these are features that are difficult to explain within the standard model of cosmology, which relies on the assumption that the Universe, on large scales, has the same properties when observed in all directions.
The most serious anomaly is a deficit in the signal observed on scales around 5 degrees, which is about ten per cent weaker than predicted. Other anomalous traits are a significant discrepancy of the signal as observed in the two opposite hemispheres of the sky (the two hemispheres are outlined by the large, roughly u-shaped curve in the image, the northern one being at the centre) and a so-called 'cold spot' – a large, low-temperature spot with an unusually steep temperature profile (also outlined in the lower right).
A comparison between the top map, showing the total Planck measurement – comprising both signal and noise – with the bottom map, showing only the noise, indicates that the anomalous features are clearly not artefacts as they are indeed present in the signal and not in the noise.")
Alt...
Map of the cosmic microwave background (CMB) temperature as observed by ESA’s Planck satellite. While fluctuations in the CMB are present and were observed by Planck down to very small angular scales, these images have been filtered to show mostly the signal detected on fairly large scales in the sky, around 5 degrees and larger – as a comparison, the full Moon spans about half a degree.
On these large scales, a number of anomalies are observed in the CMB temperature – these are features that are difficult to explain within the standard model of cosmology, which relies on the assumption that the Universe, on large scales, has the same properties when observed in all directions.
The most serious anomaly is a deficit in the signal observed on scales around 5 degrees, which is about ten per cent weaker than predicted. Other anomalous traits are a significant discrepancy of the signal as observed in the two opposite hemispheres of the sky (the two hemispheres are outlined by the large, roughly u-shaped curve in the image, the northern one being at the centre) and a so-called 'cold spot' – a large, low-temperature spot with an unusually steep temperature profile (also outlined in the lower right).
A comparison between the top map, showing the total Planck measurement – comprising both signal and noise – with the bottom map, showing only the noise, indicates that the anomalous features are clearly not artefacts as they are indeed present in the signal and not in the noise.
2011 June 14
The Universe Nearby
* Credit: 2MASS, T. H. Jarrett, J. Carpenter, & R. Hurt
https://www.ipac.caltech.edu/2mass/
Explanation:
What does the universe nearby look like? This plot shows nearly 50,000 galaxies in the nearby universe detected by the Two Micron All Sky Survey (2MASS) in infrared light. The resulting image is anincredible tapestry of galaxies that provides limits on how the universe formed and evolved. The dark band across the image center is blocked by dust in the plane of our own Milky Way Galaxy. Away from the Galactic plane, however, each dot represents a galaxy, color coded to indicate distance. Bluer dots represent the nearer galaxies in the 2MASS survey, while redder dots indicating the more distant survey galaxies that lie at a redshift near 0.1. Named structures are annotated around the edges. Many galaxies are gravitationally bound together to form clusters, which themselves are loosely bound into superclusters, which in turn are sometimes seen to align over even larger scale structures.
https://apod.nasa.gov/apod/ap110614.html
#space #universe #map #astronomy #astrophotography #photography #science #nature #NASA #ESA #education
 in infrared light. The resulting image is anincredible tapestry of galaxies that provides limits on how the universe formed and evolved. The dark band across the image center is blocked by dust in the plane of our own Milky Way Galaxy. Away from the Galactic plane, however, each dot represents a galaxy, color coded to indicate distance. Bluer dots represent the nearer galaxies in the 2MASS survey, while redder dots indicating the more distant survey galaxies that lie at a redshift near 0.1. Named structures are annotated around the edges. Many galaxies are gravitationally bound together to form clusters, which themselves are loosely bound into superclusters, which in turn are sometimes seen to align over even larger scale structures.
Authors & editors: Robert Nemiroff (MTU) & Jerry Bonnell (UMCP)
NASA Official: Phillip Newman Specific rights apply.
NASA Web Privacy Policy and Important Notices
A service of: ASD at NASA / GSFC
& Michigan Tech. U.")
Alt...
2011 June 14
The Universe Nearby
* Credit: 2MASS, T. H. Jarrett, J. Carpenter, & R. Hurt
Explanation:
What does the universe nearby look like? This plot shows nearly 50,000 galaxies in the nearby universe detected by the Two Micron All Sky Survey (2MASS) in infrared light. The resulting image is anincredible tapestry of galaxies that provides limits on how the universe formed and evolved. The dark band across the image center is blocked by dust in the plane of our own Milky Way Galaxy. Away from the Galactic plane, however, each dot represents a galaxy, color coded to indicate distance. Bluer dots represent the nearer galaxies in the 2MASS survey, while redder dots indicating the more distant survey galaxies that lie at a redshift near 0.1. Named structures are annotated around the edges. Many galaxies are gravitationally bound together to form clusters, which themselves are loosely bound into superclusters, which in turn are sometimes seen to align over even larger scale structures.
Authors & editors: Robert Nemiroff (MTU) & Jerry Bonnell (UMCP)
NASA Official: Phillip Newman Specific rights apply.
NASA Web Privacy Policy and Important Notices
A service of: ASD at NASA / GSFC
& Michigan Tech. U.
2023 July 5
A Map of the Observable Universe
* Image Credit & Copyright: B. Ménard & N. Shtarkman; Data: SDSS, Planck, JHU, Sloan, NASA, ESA
Explanation:
What if you could see out to the edge of the observable universe? You would see galaxies, galaxies, galaxies, and then, well, quasars, which are the bright centers of distant galaxies. To expand understanding of the very largest scales that humanity can see, a map of the galaxies and quasars found by the Sloan Digital Sky Survey from 2000 to 2020 -- out to near the edge of the observable universe -- has been composed. Featured here, one wedge from this survey encompasses about 200,000 galaxies and quasars out beyond a look-back time of 12 billion years and cosmological redshift 5. Almost every dot in the nearby lower part of the illustration represents a galaxy, with redness indicating increasing redshift and distance. Similarly, almost every dot on the upper part represents a distant quasar, with blue-shaded dots being closer than red. Clearly shown among many discoveries, gravity between galaxies has caused the nearby universe to condense and become increasingly more filamentary than the distant universe.
!>> https://mapoftheuniverse.net/
https://apod.nasa.gov/apod/ap230705.html
#space #universe #map #astronomy #astrophotography #photography #science #nature #NASA #ESA #education
 & Jerry Bonnell (UMCP)
NASA Official: Phillip Newman Specific rights apply.")
Alt...
2023 July 5
A map of the observable universe is illustrated in a wedge with the the Earth on the bottom and the universe fanning out above. Please see the explanation for more detailed information.
A Map of the Observable Universe
* Image Credit & Copyright: B. Ménard & N. Shtarkman; Data: SDSS, Planck, JHU, Sloan, NASA, ESA
Explanation:
What if you could see out to the edge of the observable universe? You would see galaxies, galaxies, galaxies, and then, well, quasars, which are the bright centers of distant galaxies. To expand understanding of the very largest scales that humanity can see, a map of the galaxies and quasars found by the Sloan Digital Sky Survey from 2000 to 2020 -- out to near the edge of the observable universe -- has been composed. Featured here, one wedge from this survey encompasses about 200,000 galaxies and quasars out beyond a look-back time of 12 billion years and cosmological redshift 5. Almost every dot in the nearby lower part of the illustration represents a galaxy, with redness indicating increasing redshift and distance. Similarly, almost every dot on the upper part represents a distant quasar, with blue-shaded dots being closer than red. Clearly shown among many discoveries, gravity between galaxies has caused the nearby universe to condense and become increasingly more filamentary than the distant universe.
Authors & editors: Robert Nemiroff (MTU) & Jerry Bonnell (UMCP)
NASA Official: Phillip Newman Specific rights apply.
2014 May 12
Illustris Simulation of the Universe
* Video Credit: Illustris Collaboration, NASA, PRACE, XSEDE, MIT, Harvard CfA;
https://physics.mit.edu/faculty/mark-vogelsberger/
https://www.illustris-project.org/people/
https://prace-ri.eu/
https://www.cfa.harvard.edu/
https://www.xsede.org/
https://www.nasa.gov/
* Music: The Poisoned Princess (Media Right Productions)
https://www.mediarightproductions.com/
Explanation:
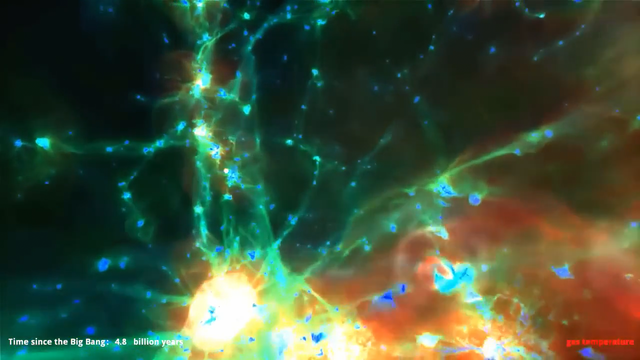
How did we get here? Click play, sit back, and watch. A new computer simulation of the evolution of the universe -- the largest and most sophisticated yet produced -- provides new insight into how galaxies formed and new perspectives into humanity's place in the universe. The Illustris project -- the largest of its type yet -- exhausted 20 million CPU hours following 12 billion resolution elements spanning a cube 35 million light years on a side as it evolved over 13 billion years. The simulation is the first to track matter into the formation of a wide variety of galaxy types. As the virtual universe evolves, some of the matter expanding with the universe soon gravitationally condenses to form filaments, galaxies, and clusters of galaxies. The above video takes the perspective of a virtual camera circling part of this changing universe, first showing the evolution of dark matter, then hydrogen gas coded by temperature (0:45), then heavy elements such as helium and carbon (1:30), and then back to dark matter (2:07). On the lower left the time since the Big Bang is listed, while on the lower right the type of matter being shown is listed. Explosions (0:50) depict galaxy-center supermassive black holes expelling bubbles of hot gas. Interesting discrepancies between Illustris and the real universe do exist and are being studied, including why the simulation produces an overabundance of old stars.
https://apod.nasa.gov/apod/ap140512.html
* i converted and compressed this video to mp4 -crf 28 with ffmpeg
#space #universe #map #astronomy #astrophotography #photography #science #nature #NASA #ESA #education
Alt...
2014 May 12
Illustris Simulation of the Universe
* Video Credit: Illustris Collaboration, NASA, PRACE, XSEDE, MIT, Harvard CfA;
* Music: The Poisoned Princess (Media Right Productions)
Explanation:
How did we get here? Click play, sit back, and watch. A new computer simulation of the evolution of the universe -- the largest and most sophisticated yet produced -- provides new insight into how galaxies formed and new perspectives into humanity's place in the universe. The Illustris project -- the largest of its type yet -- exhausted 20 million CPU hours following 12 billion resolution elements spanning a cube 35 million light years on a side as it evolved over 13 billion years. The simulation is the first to track matter into the formation of a wide variety of galaxy types. As the virtual universe evolves, some of the matter expanding with the universe soon gravitationally condenses to form filaments, galaxies, and clusters of galaxies. The above video takes the perspective of a virtual camera circling part of this changing universe, first showing the evolution of dark matter, then hydrogen gas coded by temperature (0:45), then heavy elements such as helium and carbon (1:30), and then back to dark matter (2:07). On the lower left the time since the Big Bang is listed, while on the lower right the type of matter being shown is listed. ..
Authors & editors: Robert Nemiroff (MTU) & Jerry Bonnell (UMCP)
NASA Official: Phillip Newman Specific rights apply.
Illustris simulation overview poster. Shows the large scale dark matter and gas density fields in projection (top/bottom). The lower three panels show gas temperature, entropy, and velocity at the same scale. Centered on the most massive cluster, for which the circular insets show four predicted observables. The two galaxy insets highlight a central elliptical and a spiral disk satellite (top/bottom).
Credits:
Illustris
www.illustris-project.org
#space #universe #map #astronomy #astrophotography #photography #science #nature #NASA #ESA #education
. The lower three panels show gas temperature, entropy, and velocity at the same scale. Centered on the most massive cluster, for which the circular insets show four predicted observables. The two galaxy insets highlight a central elliptical and a spiral disk satellite (top/bottom).")
Alt...
Illustris simulation overview poster. Shows the large scale dark matter and gas density fields in projection (top/bottom). The lower three panels show gas temperature, entropy, and velocity at the same scale. Centered on the most massive cluster, for which the circular insets show four predicted observables. The two galaxy insets highlight a central elliptical and a spiral disk satellite (top/bottom).
Most detailed simulation of our Universe
The Illustris simulation is the most ambitious computer simulation of our Universe yet performed. The calculation tracks the expansion of the universe, the gravitational pull of matter onto itself, the motion of cosmic gas, as well as the formation of stars and black holes. These physical components and processes are all modeled starting from initial conditions resembling the very young universe 300,000 years after the Big Bang and until the present day, spanning over 13.8 billion years of cosmic evolution. The simulated volume contains tens of thousands of galaxies captured in high-detail, covering a wide range of masses, rates of star formation, shapes, sizes, and with properties that agree well with the galaxy population observed in the real universe. The simulations were run on supercomputers in France, Germany, and the US. The largest was run on 8,192 compute cores, and took 19 million CPU hours. A single state-of-the-art desktop computer would require more than 2000 years to perform this calculation.
Find out more at:
http://www.illustris-project.org
Publication:
"Properties of galaxies reproduced by a hydrodynamic simulation", Vogelsberger, Genel, Springel, Torrey, Sijacki, Xu, Snyder, Bird, Nelson, Hernquist, Nature 509, 177-182 (08 May 2014) doi:10.1038/nature13316
Music:
moonbooter (http://www.moonbooter.de/)
Institutes:
Massachusetts Institute of Technology, Harvard University, Heidelberg Institute for Theoretical Studies, University of Cambridge, Institute for Advanced Study Princeton, Space Telescope Science Institute
-The Illustris Collaboration
https://www.illustris-project.org/
* i converted and compressed this video to mp4 -crf 33 with ffmpeg
#space #universe #map #astronomy #astrophotography #photography #science #nature #NASA #ESA #education

Alt...
The Illustris simulation is the most ambitious computer simulation of our Universe yet performed. The calculation tracks the expansion of the universe, the gravitational pull of matter onto itself, the motion of cosmic gas, as well as the formation of stars and black holes. These physical components and processes are all modeled starting from initial conditions resembling the very young universe 300,000 years after the Big Bang and until the present day, spanning over 13.8 billion years of cosmic evolution. The simulated volume contains tens of thousands of galaxies captured in high-detail, covering a wide range of masses, rates of star formation, shapes, sizes, and with properties that agree well with the galaxy population observed in the real universe. The simulations were run on supercomputers in France, Germany, and the US. The largest was run on 8,192 compute cores, and took 19 million CPU hours. A single state-of-the-art desktop computer would require more than 2000 years to perform this calculation.
Institutes:
Massachusetts Institute of Technology, Harvard University, Heidelberg Institute for Theoretical Studies, University of Cambridge, Institute for Advanced Study Princeton, Space Telescope Science Institute
* i converted and compressed this video to mp4 -crf 33 with ffmpeg
Saturn Moons
more about:
+ Dione
https://science.nasa.gov/saturn/moons/dione/
+ Rhea
https://science.nasa.gov/saturn/moons/rhea/
+ Helene
https://science.nasa.gov/saturn/moons/helene/
+ Atlas
https://science.nasa.gov/saturn/moons/atlas/
Please read the ALT-Texts for short overviews.
#space #saturn #astrophotography #photography #science #astronomy #physics #nature #NASA #ESA #education
 in mean radius orbiting Saturn every 2.7 days at a distance of 234,500 miles (377,400 km), which is roughly the same distance that our Moon orbits Earth.
Dione's density is 1.48 times that of liquid water, suggesting that about a third of Dione is made up of a dense core (probably silicate rock) with the remainder of its material being ice. At Dione's average temperature of -304 degrees Fahrenheit (-186 degrees Celsius or 87 kelvins), ice is very hard and behaves like rock.
Very fine ice powder (equivalent to smoke) from Saturn's E-ring constantly bombards Dione. The dust in the E-ring ultimately comes from Enceladus, which has prominent geyser activity.")
Alt...
Saturn's moon Dione is captured in this view from NASA's Cassini spacecraft, half in shadow and half in light.
NASA/JPL-Caltech/Space Science Institute
Dione
is a small moon of 349 miles (562 km) in mean radius orbiting Saturn every 2.7 days at a distance of 234,500 miles (377,400 km), which is roughly the same distance that our Moon orbits Earth.
Dione's density is 1.48 times that of liquid water, suggesting that about a third of Dione is made up of a dense core (probably silicate rock) with the remainder of its material being ice. At Dione's average temperature of -304 degrees Fahrenheit (-186 degrees Celsius or 87 kelvins), ice is very hard and behaves like rock.
Very fine ice powder (equivalent to smoke) from Saturn's E-ring constantly bombards Dione. The dust in the E-ring ultimately comes from Enceladus, which has prominent geyser activity.
 it is less than a third the radius of Saturn's largest moon, Titan. Rhea is a small, cold, airless body that is very similar to sister moons Dione and Tethys. As with the other two moons, Rhea is tidally locked in phase with its parent — one side always faces toward Saturn — as it completes its 4.5-Earth-day orbit around the planet. Rhea's surface temperatures are also similar to Dione and Tethys, being roughly as warm as -281 degrees Fahrenheit (-174 degrees Celsius) in sunlit areas and ranging down to -364 degrees Fahrenheit (-220 degrees Celsius) in shaded areas. Also like Dione and Tethys, Rhea has a high reflectivity (or geometric albedo) suggesting a surface composition largely of water ice, which behaves like rock in Rhea's temperature range.
Rhea's density of 1.233 times that of liquid water suggests that Rhea is three quarters ice and one quarter rock. Cassini spacecraft measurements from a close encounter showed a moment of inertia about its axis (a measure of how difficult it is to change its rotation) of a higher value than what would be expected if Rhea has a rocky core. Thus, it is thought that Rhea is composed of a homogenous mixture of ice and rock — a frozen dirty snowball at a distance of 327,500 miles (527,000 kilometers)")
Alt...
The Cassini spacecraft looks toward the cratered plains of the trailing hemisphere of Rhea.
NASA/JPL/Space Science Institute
Rhea is the second largest moon of Saturn, but with a mean radius of 475 miles (764 kilometers) it is less than a third the radius of Saturn's largest moon, Titan. Rhea is a small, cold, airless body that is very similar to sister moons Dione and Tethys. As with the other two moons, Rhea is tidally locked in phase with its parent — one side always faces toward Saturn — as it completes its 4.5-Earth-day orbit around the planet. Rhea's surface temperatures are also similar to Dione and Tethys, being roughly as warm as -281 degrees Fahrenheit (-174 degrees Celsius) in sunlit areas and ranging down to -364 degrees Fahrenheit (-220 degrees Celsius) in shaded areas. Also like Dione and Tethys, Rhea has a high reflectivity (or geometric albedo) suggesting a surface composition largely of water ice, which behaves like rock in Rhea's temperature range.
Rhea's density of 1.233 times that of liquid water suggests that Rhea is three quarters ice and one quarter rock. Cassini spacecraft measurements from a close encounter showed a moment of inertia about its axis (a measure of how difficult it is to change its rotation) of a higher value than what would be expected if Rhea has a rocky core. Thus, it is thought that Rhea is composed of a homogenous mixture of ice and rock — a frozen dirty snowball at a distance of 327,500 miles (527,000 kilometers)
 with dimensions 22 x 19 x 18.6 miles (36 x 32 x 30 km). It orbits 234,505 miles (377,400 kilometers) away from Saturn, taking 2.7 Earth days to complete one orbit.")
Alt...
Although travelling at great speed, the Cassini spacecraft managed to capture this close view of Saturn's small moon Helene during a flyby on March 3, 2010.
NASA/JPL/Space Science Institute
Helene, a small and faint moon of Saturn, is referred to as a Trojan moon because it shares its orbit with another moon—Dione, a moon hundreds of times larger than Helene. This complex orbital arrangement is held steady by gravity: Helene is located at a Lagrange point, where it feels the tug of gravity equally from distant Saturn and nearby Dione. For this reason, soon after it was discovered in 1980 it was called Dione B.
This irregularly shaped moon has a mean radius of 10.9 miles (17.6 kilometers) with dimensions 22 x 19 x 18.6 miles (36 x 32 x 30 km). It orbits 234,505 miles (377,400 kilometers) away from Saturn, taking 2.7 Earth days to complete one orbit.
. It orbits 85,544 miles (137,670 km) away from, taking 14.4 hours to complete its trip around the planet.")
Alt...
This montage of views from NASA's Cassini spacecraft shows three of Saturn's small ring moons: Atlas, Daphnis and Pan at the same scale for ease of comparison.
NASA/JPL-Caltech/Space Science Institute
Atlas
is an inner moon of Saturn, orbiting around the outer edge of Saturn's A Ring. Like Pan, Atlas has a distinctive flying saucer shape created by a prominent equatorial ridge not seen on the other small moons of Saturn. Cassini images revealed in 2004 that a temporary faint ring of material with the orbit of Atlas.
The small, pointy moon has a mean radius of 9.4 miles (15.1 km). It orbits 85,544 miles (137,670 km) away from, taking 14.4 hours to complete its trip around the planet.
Saturn Moons
more about:
+ Iapetus
https://science.nasa.gov/saturn/moons/iapetus/
+ Phoebe
https://science.nasa.gov/saturn/moons/phoebe/
+ Tethys
https://science.nasa.gov/saturn/moons/tethys/
+ Telesto
https://science.nasa.gov/saturn/moons/telesto/
Please read the ALT-Texts for short overviews.
#space #saturn #astrophotography #photography #science #astronomy #physics #nature #NASA #ESA #education
 as dark as coal (albedo 0.03-0.05 with a slight reddish tinge) and its trailing hemisphere is much brighter at 0.5-0.6.
Saturn's third largest moon, Iapetus has a mean radius of 457 miles (736 kilometers) and a density only 1.2 times that of liquid water. It has been suggested that Iapetus (like Rhea) is three quarters ice and one quarter rock.
Iapetus orbits at 2,213,000 miles (3,561,000 kilometers) from Saturn. The great distance from Saturn's tidal forces and from most of the other moons and ring particles has probably allowed the Iapetus surface to be largely unaffected by any melting episodes that could have caused some smoothing or \"resurfacing\" as on some of the moons closer to Saturn.
However, despite the great distance, Saturn has tidally locked Iapetus. The moon always presents the same face toward Saturn. With its distant, inclined orbit, Iapetus is the only large moon from which there is a nice view of the rings of Saturn.
As with some other Saturnian moons, Iapetus is in resonance with Saturn's largest moon, Titan, which orbits at 759,200 miles (1,221,850 kilometers)")
Alt...
These two global images of Iapetus show the extreme brightness dichotomy on the surface of this peculiar Saturnian moon. The left-hand panel shows the moon's leading hemisphere and the right-hand panel shows the moon's trailing side.
NASA/JPL-Caltech/Space Science Institute
Iapetus
has been called the yin and yang of the Saturn moons because its leading hemisphere has a reflectivity (or albedo) as dark as coal (albedo 0.03-0.05 with a slight reddish tinge) and its trailing hemisphere is much brighter at 0.5-0.6.
Saturn's third largest moon, Iapetus has a mean radius of 457 miles (736 kilometers) and a density only 1.2 times that of liquid water. It has been suggested that Iapetus (like Rhea) is three quarters ice and one quarter rock.
Iapetus orbits at 2,213,000 miles (3,561,000 kilometers) from Saturn. The great distance from Saturn's tidal forces and from most of the other moons and ring particles has probably allowed the Iapetus surface to be largely unaffected by any melting episodes that could have caused some smoothing or "resurfacing" as on some of the moons closer to Saturn.
However, despite the great distance, Saturn has tidally locked Iapetus. The moon always presents the same face toward Saturn. With its distant, inclined orbit, Iapetus is the only large moon from which there is a nice view of the rings of Saturn.
As with some other Saturnian moons, Iapetus is in resonance with Saturn's largest moon, Titan, which orbits at 759,200 miles (1,221,850 kilometers)
 from the planet, almost four times the distance from Saturn than its nearest neighbor, the moon Iapetus. Phoebe and Iapetus are the only major moons in the Saturnian system that do not orbit closely to the plane of Saturn's equator.
Phoebe is roughly spherical and has a mean radius of about 66.2 miles (106.5 kilometers), about one-sixteenth the radius of Earth's Moon. Phoebe rotates on its axis every nine hours, and it completes a full orbit around Saturn in about 18 Earth months. Its irregular, elliptical orbit is inclined about 175 degrees to Saturn's equator. Phoebe's orbit is also retrograde, which means it goes around Saturn in the opposite direction than most other moons — as well as most objects in the solar system.
Unlike most major moons orbiting Saturn, Phoebe is very dark and reflects only 6 percent of the sunlight it receives. Its darkness and irregular, retrograde orbit suggest Phoebe is most likely a captured object. A captured object is a celestial body that is trapped by the gravitational pull of a much bigger body, generally a planet. Phoebe's darkness, in particular, suggests that the small moon comes from the outer solar system, an area where there is plenty of dark material.")
Alt...
Phoebe's true nature is revealed in startling clarity in this mosaic of two images taken during Cassini's flyby on June 11, 2004.
NASA/JPL
Phoebe
is one of Saturn's most intriguing moons, orbiting at a distance of 8,049,668 miles (12,952,000 kilometers) from the planet, almost four times the distance from Saturn than its nearest neighbor, the moon Iapetus. Phoebe and Iapetus are the only major moons in the Saturnian system that do not orbit closely to the plane of Saturn's equator.
Phoebe is roughly spherical and has a mean radius of about 66.2 miles (106.5 kilometers), about one-sixteenth the radius of Earth's Moon. Phoebe rotates on its axis every nine hours, and it completes a full orbit around Saturn in about 18 Earth months. Its irregular, elliptical orbit is inclined about 175 degrees to Saturn's equator. Phoebe's orbit is also retrograde, which means it goes around Saturn in the opposite direction than most other moons — as well as most objects in the solar system.
Unlike most major moons orbiting Saturn, Phoebe is very dark and reflects only 6 percent of the sunlight it receives. Its darkness and irregular, retrograde orbit suggest Phoebe is most likely a captured object. A captured object is a celestial body that is trapped by the gravitational pull of a much bigger body, generally a planet. Phoebe's darkness, in particular, suggests that the small moon comes from the outer solar system, an area where there is plenty of dark material.
 in mean radius, with dimensions 669 x 657 x 654 miles (1076.8 x 1057.4 x 1052.6 kilometers). This cold, airless and heavily scarred body is very similar to sister moons DionThe Voyager images showed a major impact crater and a great chasm. The Cassini spacecraft has added details including a great variety of colors at small scales suggesting a variety of materials not seen elsewhere.e and Rhea except that Tethys is not as heavily cratered as the other two. This may be because its proximity to Saturn causes more tidal warming, and that warming kept Tethys partially molten longer, erasing or dulling more of the early terrain.
Tethys' density is 0.97 times that of liquid water, which suggests that Tethys is composed almost entirely of water ice plus a small amount of rock.
Tethys has a high reflectivity (or visual albedo) of 1.229 in the visual range, again suggesting a composition largely of water ice, which would behave like rock in the Tethyan average temperature of -305 degrees Fahrenheit (-187 degrees Celsius). Many of the crater floors on Tethys are bright, which also suggests an abundance of water ice. Also contributing to the high reflectivity is that Tethys is bombarded by Saturn E-ring water-ice particles generated by geysers on Enceladus")
Alt...
The vast expanse of the crater Odysseus spreads out below Cassini in this mosaic view of Saturn's moon Tethys.
NASA/JPL/Space Science Institute
Tethys
is Saturn's fifth largest moon. Its irregular shape is 331 miles (533 kilometers) in mean radius, with dimensions 669 x 657 x 654 miles (1076.8 x 1057.4 x 1052.6 kilometers). This cold, airless and heavily scarred body is very similar to sister moons DionThe Voyager images showed a major impact crater and a great chasm. The Cassini spacecraft has added details including a great variety of colors at small scales suggesting a variety of materials not seen elsewhere.e and Rhea except that Tethys is not as heavily cratered as the other two. This may be because its proximity to Saturn causes more tidal warming, and that warming kept Tethys partially molten longer, erasing or dulling more of the early terrain.
Tethys' density is 0.97 times that of liquid water, which suggests that Tethys is composed almost entirely of water ice plus a small amount of rock.
Tethys has a high reflectivity (or visual albedo) of 1.229 in the visual range, again suggesting a composition largely of water ice, which would behave like rock in the Tethyan average temperature of -305 degrees Fahrenheit (-187 degrees Celsius). Many of the crater floors on Tethys are bright, which also suggests an abundance of water ice. Also contributing to the high reflectivity is that Tethys is bombarded by Saturn E-ring water-ice particles generated by geysers on Enceladus
 from Saturn, the moon takes 45.3 hours to make one trip around the planet. Telesto orbits about 60 degrees ahead of Tethys, while Calypso orbits behind Tethys by about 60 degrees. Because Telesto is in the front of this three-moon group, it is called the \"leading Trojan.\"
Telesto is 7.7 miles (12.4 kilometers) in mean radius and appears to have a smooth, icy surface. It does not show the signs of intense cratering seen on many of Saturn's other moons.")
Alt...
The Cassini spacecraft passed within a cosmic stone's throw of Telesto in October, 2005 capturing this shot of the tiny Trojan moon.
NASA/JPL/Space Science Institute
Telesto
is known as a "Tethys Trojan" because, together with Calypso, it circles Saturn in the same orbit as the moon Tethys. At a distance of about 183,000 miles (295,000 kilometers) from Saturn, the moon takes 45.3 hours to make one trip around the planet. Telesto orbits about 60 degrees ahead of Tethys, while Calypso orbits behind Tethys by about 60 degrees. Because Telesto is in the front of this three-moon group, it is called the "leading Trojan."
Telesto is 7.7 miles (12.4 kilometers) in mean radius and appears to have a smooth, icy surface. It does not show the signs of intense cratering seen on many of Saturn's other moons.
Saturn Moons
more about:
+ Pandora
https://science.nasa.gov/saturn/moons/pandora/
+ Janus
https://science.nasa.gov/saturn/moons/janus/
+ Epimetheus
https://science.nasa.gov/saturn/moons/epimetheus/
+ Mimas
https://science.nasa.gov/saturn/moons/mimas/
Please read the ALT-Texts for short overviews.
#space #saturn #astrophotography #photography #science #astronomy #physics #nature #NASA #ESA #education
 icy material. Even the craters on Pandora are coated in debris, a stark contrast to the crisply-defined craters of other moons, such as Hyperion. Curious grooves and ridges also appear to cross the surface of the small moon.
Pandora is interesting because it tends to disrupt the F ring, while Prometheus helps to keep the primary ring in place.
Pandora is about 25.3 miles (40.7 kilometers) in mean radius. It orbits 88,000 miles (142,000 kilometers) away from Saturn, near the F ring, taking 15.1 hours to go around Saturn.")
Alt...
Cassini's best close-up view of Saturn's F ring shepherd moon, Pandora, shows that this small ring-moon is coated in fine dust-sized icy material.
NASA/JPL
Pandora,
a potato-shaped moon, is coated in a fine (dust-sized) icy material. Even the craters on Pandora are coated in debris, a stark contrast to the crisply-defined craters of other moons, such as Hyperion. Curious grooves and ridges also appear to cross the surface of the small moon.
Pandora is interesting because it tends to disrupt the F ring, while Prometheus helps to keep the primary ring in place.
Pandora is about 25.3 miles (40.7 kilometers) in mean radius. It orbits 88,000 miles (142,000 kilometers) away from Saturn, near the F ring, taking 15.1 hours to go around Saturn.
 and dimensions of 122 x 119 x 93 miles (196 x 192 x 150 kilometers, respectively).
Janus is extensively cratered with several craters larger than 19 miles (30 kilometers). Janus' prominent craters are named Castor, Phoebe, Idas and Lynceus.
This oblong moon orbits 94,000 miles (151,000 kilometers) away from Saturn, taking 17 hours to complete one orbit, in the gap between the F and G rings, but it doesn't do this alone. It actually shares its orbit with a sister moon named Epimetheus, in what is called a co-orbital condition or 1:1 resonance.
One moon orbits 31 miles (50 km) farther away from the planet than the other, taking more time to complete one turn around Saturn. This slight difference means the inner, faster moving moon starts to catch up to the other approximately every four Earth years. Interestingly, when this happens, the gravity interaction between the moons causes them to trade places between these inner and outer orbits. The closest they get is about 6,200 miles (15,000 km). This is the only such orbital configuration known in the solar system.")
Alt...
Shadows darken parts of some of Janus' large craters as Cassini takes a close look during its flyby of this Saturnian moon on March 27, 2012.
NASA/JPL-Caltech/Space Science Institute
Janus
is a potato-shaped moon with a mean radius of 55.6 miles (89.5 kilometers) and dimensions of 122 x 119 x 93 miles (196 x 192 x 150 kilometers, respectively).
Janus is extensively cratered with several craters larger than 19 miles (30 kilometers). Janus' prominent craters are named Castor, Phoebe, Idas and Lynceus.
This oblong moon orbits 94,000 miles (151,000 kilometers) away from Saturn, taking 17 hours to complete one orbit, in the gap between the F and G rings, but it doesn't do this alone. It actually shares its orbit with a sister moon named Epimetheus, in what is called a co-orbital condition or 1:1 resonance.
One moon orbits 31 miles (50 km) farther away from the planet than the other, taking more time to complete one turn around Saturn. This slight difference means the inner, faster moving moon starts to catch up to the other approximately every four Earth years. Interestingly, when this happens, the gravity interaction between the moons causes them to trade places between these inner and outer orbits. The closest they get is about 6,200 miles (15,000 km). This is the only such orbital configuration known in the solar system.
![NASA's Cassini spacecraft captured this view of Saturn's moon Epimetheus (116 kilometers, or 72 miles across) during a moderately close flyby on Dec. 6, 2015.
NASA/JPL-Caltech/Space Science Institute
Epimetheus
is a potato-shaped moon with a mean radius of 36 miles (58 km) and dimensions of 84 x 65 x 65 miles (135 x 108 x 105 km, respectively). Its shape reflects pronounced flattening at the Epimethean South Pole associated with the remains of a large crater. Epimetheus has several craters larger than 19 miles (30 km), including Hilairea and Pollux.
This oblong moon orbits 94,000 miles (151,000 km) away from Saturn, taking 17 hours to circle the planet, in the gap between the F and G rings, but it doesn't do this alone. It actually shares its orbit with a sister moon named Janus, in what is called a co-orbital condition or 1:1 resonance.
[...]
Epimetheus and Janus
may have formed by the break-up of one moon. If so, it would have happened early in the life of the Saturn system since both moons have ancient cratered surfaces, many with soft edges because of dust. They also have some grooves (similar to grooves on the Martian moon Phobos) suggesting some glancing blows from other bodies. Together, the moons trail enough particles to generate a faint ring. However, except for very powerful telescopes, the region of their common orbit appears as a gap between Saturn's prominent F and G rings.](https://files.defcon.social/dcsocial-s3/media_attachments/files/115/593/118/324/033/823/original/851a53b00ec3e84e.jpg "NASA's Cassini spacecraft captured this view of Saturn's moon Epimetheus (116 kilometers, or 72 miles across) during a moderately close flyby on Dec. 6, 2015.
NASA/JPL-Caltech/Space Science Institute
Epimetheus
is a potato-shaped moon with a mean radius of 36 miles (58 km) and dimensions of 84 x 65 x 65 miles (135 x 108 x 105 km, respectively). Its shape reflects pronounced flattening at the Epimethean South Pole associated with the remains of a large crater. Epimetheus has several craters larger than 19 miles (30 km), including Hilairea and Pollux.
This oblong moon orbits 94,000 miles (151,000 km) away from Saturn, taking 17 hours to circle the planet, in the gap between the F and G rings, but it doesn't do this alone. It actually shares its orbit with a sister moon named Janus, in what is called a co-orbital condition or 1:1 resonance.
[...]
Epimetheus and Janus
may have formed by the break-up of one moon. If so, it would have happened early in the life of the Saturn system since both moons have ancient cratered surfaces, many with soft edges because of dust. They also have some grooves (similar to grooves on the Martian moon Phobos) suggesting some glancing blows from other bodies. Together, the moons trail enough particles to generate a faint ring. However, except for very powerful telescopes, the region of their common orbit appears as a gap between Saturn's prominent F and G rings.")
Alt...
NASA's Cassini spacecraft captured this view of Saturn's moon Epimetheus (116 kilometers, or 72 miles across) during a moderately close flyby on Dec. 6, 2015.
NASA/JPL-Caltech/Space Science Institute
Epimetheus
is a potato-shaped moon with a mean radius of 36 miles (58 km) and dimensions of 84 x 65 x 65 miles (135 x 108 x 105 km, respectively). Its shape reflects pronounced flattening at the Epimethean South Pole associated with the remains of a large crater. Epimetheus has several craters larger than 19 miles (30 km), including Hilairea and Pollux.
This oblong moon orbits 94,000 miles (151,000 km) away from Saturn, taking 17 hours to circle the planet, in the gap between the F and G rings, but it doesn't do this alone. It actually shares its orbit with a sister moon named Janus, in what is called a co-orbital condition or 1:1 resonance.
[...]
Epimetheus and Janus
may have formed by the break-up of one moon. If so, it would have happened early in the life of the Saturn system since both moons have ancient cratered surfaces, many with soft edges because of dust. They also have some grooves (similar to grooves on the Martian moon Phobos) suggesting some glancing blows from other bodies. Together, the moons trail enough particles to generate a faint ring. However, except for very powerful telescopes, the region of their common orbit appears as a gap between Saturn's prominent F and G rings.
. It is not quite big enough to hold a round shape, so it is somewhat ovoid with dimensions of 129 x 122 x 119 miles (207 x 197 x 191 kilometers, respectively). Its low density suggests that it consists almost entirely of water ice, which is the only substance ever detected on Mimas.
At a mean distance just over 115,000 miles (186,000 kilometers) from the massive planet, Mimas takes only 22 hours and 36 minutes to complete an orbit. Mimas is tidally locked: it keeps the same face toward Saturn as it flies around the planet, just as our Moon does with Earth.
Most of the Mimas surface is saturated with impact craters ranging in size up to greater than 25 miles (40 kilometers) in diameter. However, the craters in the South Pole region of Mimas are generally 12.4 miles (20 kilometers) in diameter or less. This suggests that some melting or other resurfacing processes occurred there later than on the rest of the moon. (Interestingly, the South Pole area of Enceladus appears to be the source of that moon's geysers.)
Its most distinguishing feature is a giant impact crater – named Herschel after the moon's discoverer ...")
Alt...
NASA's Cassini spacecraft spotted Saturn's moon Mimas and its large Herschel Crater. The crater looks somewhat like an eye peering out into space.
NASA/JPL/Space Science Institute
Crater-covered Mimas is the smallest and innermost of Saturn's major moons. It has a mean diameter of about 245 miles (394 kilometers). It is not quite big enough to hold a round shape, so it is somewhat ovoid with dimensions of 129 x 122 x 119 miles (207 x 197 x 191 kilometers, respectively). Its low density suggests that it consists almost entirely of water ice, which is the only substance ever detected on Mimas.
At a mean distance just over 115,000 miles (186,000 kilometers) from the massive planet, Mimas takes only 22 hours and 36 minutes to complete an orbit. Mimas is tidally locked: it keeps the same face toward Saturn as it flies around the planet, just as our Moon does with Earth.
Most of the Mimas surface is saturated with impact craters ranging in size up to greater than 25 miles (40 kilometers) in diameter. However, the craters in the South Pole region of Mimas are generally 12.4 miles (20 kilometers) in diameter or less. This suggests that some melting or other resurfacing processes occurred there later than on the rest of the moon. (Interestingly, the South Pole area of Enceladus appears to be the source of that moon's geysers.)
Its most distinguishing feature is a giant impact crater – named Herschel after the moon's discoverer ...
Saturn Moons
The Saturn system teems with natural satellites, from planet-sized Titan to small oddballs, shaped like potatoes or ravioli.
more about:
+ Titan
https://science.nasa.gov/saturn/moons/titan/facts/
+ Enceladus
https://science.nasa.gov/saturn/moons/enceladus/
+ Hyperion
https://science.nasa.gov/saturn/moons/enceladus/
+ Prometheus
https://science.nasa.gov/saturn/moons/prometheus/
Please read the ALT-Texts for short overviews.
#space #saturn #astrophotography #photography #science #astronomy #physics #nature #NASA #ESA #education
, and is nearly 50 percent wider than Earth’s moon. Titan is about 759,000 miles (1.2 million kilometers) from Saturn, which itself is about 886 million miles (1.4 billion kilometers) from the Sun, or about 9.5 astronomical units (AU). One AU is the distance from Earth to the Sun. Light from the Sun takes about 80 minutes to reach Titan; because of the distance, sunlight is about 100 times fainter at Saturn and Titan than at Earth.")
Alt...
Titan passes in front of Saturn in this image from NASA's Cassini spacecraft.
NASA/JPL-Caltech/Space Science Institute
Titan
has a radius of about 1,600 miles (2,575 kilometers), and is nearly 50 percent wider than Earth’s moon. Titan is about 759,000 miles (1.2 million kilometers) from Saturn, which itself is about 886 million miles (1.4 billion kilometers) from the Sun, or about 9.5 astronomical units (AU). One AU is the distance from Earth to the Sun. Light from the Sun takes about 80 minutes to reach Titan; because of the distance, sunlight is about 100 times fainter at Saturn and Titan than at Earth.
 of the surface of Enceladus.
NASA/JPL/Space Science Institute
Enceladus
orbits Saturn at a distance of 148,000 miles (238,000 kilometers) between the orbits of two other moons, Mimas and Tethys. Enceladus is tidally locked with Saturn, keeping the same face toward the planet. It completes one orbit every 32.9 hours within the densest part of Saturn's E Ring. Also, like some other moons in the extensive systems of the giant planets, Enceladus is trapped in what’s called an orbital resonance, which is when two or more moons line up with their parent planet at regular intervals and interact gravitationally. Enceladus orbits Saturn twice every time Dione, a larger moon, orbits once. Dione’s gravity stretches Enceladus’ orbit into an elliptical shape, so Enceladus is sometimes closer and other times farther from Saturn, causing tidal heating within the moon.
Parts of Enceladus show craters up to 22 miles (35 kilometers) in diameter, while other regions have few craters, indicating major resurfacing events in the geologically recent past. In particular, the south polar region of Enceladus is almost entirely free of impact craters. The area is also littered with house-sized ice boulders and regions carved by tectonic patterns unique to this region of the moon.")
Alt...
This mosaic of Saturn's moon Enceladus was created with images captured by NASA's Cassini spacecraft on Oct. 9, 2008, after the spacecraft came within about 16 miles (25 kilometers) of the surface of Enceladus.
NASA/JPL/Space Science Institute
Enceladus
orbits Saturn at a distance of 148,000 miles (238,000 kilometers) between the orbits of two other moons, Mimas and Tethys. Enceladus is tidally locked with Saturn, keeping the same face toward the planet. It completes one orbit every 32.9 hours within the densest part of Saturn's E Ring. Also, like some other moons in the extensive systems of the giant planets, Enceladus is trapped in what’s called an orbital resonance, which is when two or more moons line up with their parent planet at regular intervals and interact gravitationally. Enceladus orbits Saturn twice every time Dione, a larger moon, orbits once. Dione’s gravity stretches Enceladus’ orbit into an elliptical shape, so Enceladus is sometimes closer and other times farther from Saturn, causing tidal heating within the moon.
Parts of Enceladus show craters up to 22 miles (35 kilometers) in diameter, while other regions have few craters, indicating major resurfacing events in the geologically recent past. In particular, the south polar region of Enceladus is almost entirely free of impact craters. The area is also littered with house-sized ice boulders and regions carved by tectonic patterns unique to this region of the moon.
 from Saturn in an eccentric orbit. This contributes to variations in the spin or rotation of Hyperion. A stronger effect on Hyperion's rotation is that it is in resonance with Saturn's largest moon, Titan, which orbits at 759,200 miles (1,221,850 kilometers). Thus, the two objects speed up and slow down as they pass each other in a complex set of variations. Because Hyperion is much smaller than Titan, its rotation and orbit are affected vastly more than the larger moon, and Titan apparently keeps the Hyperion orbit eccentric rather than growing more circular over time.
The great distance from Saturn and resonance with Titan has also kept Hyperion from becoming tidally locked facing Saturn. Hyperion rotates roughly every 13 days during its 21-day orbit.")
Alt...
This stunning false-color view of Saturn's moon Hyperion reveals crisp details across the strange, tumbling moon's surface. Differences in color could represent differences in the composition of surface materials. The view was obtained during Cassini's close flyby on Sept. 26, 2005.
NASA/JPL-Caltech/Space Science Institute
Hyperion
rotates chaotically, tumbling unpredictably through space as it orbits Saturn. Hyperion orbits at a mean distance of 933,000 miles (1,500,000 kilometers) from Saturn in an eccentric orbit. This contributes to variations in the spin or rotation of Hyperion. A stronger effect on Hyperion's rotation is that it is in resonance with Saturn's largest moon, Titan, which orbits at 759,200 miles (1,221,850 kilometers). Thus, the two objects speed up and slow down as they pass each other in a complex set of variations. Because Hyperion is much smaller than Titan, its rotation and orbit are affected vastly more than the larger moon, and Titan apparently keeps the Hyperion orbit eccentric rather than growing more circular over time.
The great distance from Saturn and resonance with Titan has also kept Hyperion from becoming tidally locked facing Saturn. Hyperion rotates roughly every 13 days during its 21-day orbit.
 during a moderately close flyby on Dec. 6, 2015.
NASA/JPL-Caltech/Space Science Institute
Prometheus
acts as a shepherding moon, constraining the extent of the inner edge of Saturn's F Ring. Prometheus is extremely irregular and has visible craters — some up to 12.4 miles (20 kilometers) in diameter. However, it is much less cratered than its nearby neighbors Pandora, Janus and Epimetheus. The density of Prometheus has been estimated to be low; it is probably a porous, icy body.
The potato-shaped moon is about 26.8 miles (43.1 kilometers) in mean radius, orbiting Saturn at a distance of 87,000 miles (139,000 kilometers), taking 14.7 hours to go around the planet.")
Alt...
NASA's Cassini spacecraft spied details on the pockmarked surface of Saturn's moon Prometheus (86 kilometers, or 53 miles across) during a moderately close flyby on Dec. 6, 2015.
NASA/JPL-Caltech/Space Science Institute
Prometheus
acts as a shepherding moon, constraining the extent of the inner edge of Saturn's F Ring. Prometheus is extremely irregular and has visible craters — some up to 12.4 miles (20 kilometers) in diameter. However, it is much less cratered than its nearby neighbors Pandora, Janus and Epimetheus. The density of Prometheus has been estimated to be low; it is probably a porous, icy body.
The potato-shaped moon is about 26.8 miles (43.1 kilometers) in mean radius, orbiting Saturn at a distance of 87,000 miles (139,000 kilometers), taking 14.7 hours to go around the planet.
Saturn
+ has 63 confirmed and named moons.
+ Only seven moons of the planet Saturn are visible.
+ Two of Saturn’s moons hold a certain potential for life in subsurface habitats.
A moon is essentially an astronomical body that describes an orbit around a planet, a dwarf planet, or an asteroid.
Earth has only one moon, but other planets have two or more moons or none at all. In the Solar System, Mercury and Venus do not have any moons, Mars has two small, close-orbiting moons called Phobos and Deimos, and Jupiter has as many as 80 moons.
In the case of Saturn, it has 63 confirmed and named moons, and another 20 are awaiting confirmation of discovery and official naming by the International Astronomical Union (IAU).
from
Maia Mulko
interestingengineering.com
https://interestingengineering.com/culture/facts-about-saturn-moons
#space #saturn #astrophotography #photography #science #astronomy #physics #nature #NASA #ESA #education
, Titan can be spotted even in urban skies with a 60-millimeter (2-inch) telescope.")
Alt...
Major moons of Saturn.
How many Saturn moons are visible?
Only seven moons of the planet Saturn are visible. Titan is the easiest to see because it is the biggest and brightest.
With a diameter of 3,199.7 miles (about 5,150 kilometers), Titan can be spotted even in urban skies with a 60-millimeter (2-inch) telescope.
SubTopic> Moons of Saturn
Group Portrait
On July 29, 2011, Cassini captured five of Saturn's moons in a single frame with its narrow-angle camera. This is a full-color look at a view that was originally published in September 2011 (see PIA14573).
Moons visible in this view: Janus (111 miles, or 179 kilometers across) is on the far left; Pandora (50 miles, or 81 kilometers across) orbits just beyond the thin F ring near the center of the image; brightly reflective Enceladus (313 miles, or 504 kilometers across) appears above center; Saturn's second largest moon, Rhea (949 miles, or 1,528 kilometers across), is bisected by the right edge of the image; and the smaller moon Mimas (246 miles, or 396 kilometers across) is seen just to the left of Rhea.
This view looks toward the northern, sunlit side of the rings from just above the ringplane. Rhea is closest to Cassini here. The rings are beyond Rhea and Mimas. Enceladus is beyond the rings. The view was acquired at a distance of approximately 684,000 miles (1.1 million kilometers) from Rhea and 1.1 million miles (1.8 million kilometers) from Enceladus.
PIA12797
Credits: NASA/JPL-Caltech/Space Science Institute
#space #saturn #astrophotography #photography #science #astronomy #physics #nature #NASA #ESA #education
:
Cassini
Huygens
Spacecraft(s):
Cassini Orbiter
Instrument(s):
Imaging Science Subsystem - Narrow Angle")
Alt...
Image Addition Date:
07/30/2018
Target:
Saturn
Is a satellite of:
Sun
Mission(s):
Cassini
Huygens
Spacecraft(s):
Cassini Orbiter
Instrument(s):
Imaging Science Subsystem - Narrow Angle
Saturn's Rings
- NASA Science, Alicia Cermak
This is an artist's concept of Saturn's rings and major icy moons.
Saturn's rings make up an enormous, complex structure. From edge-to-edge, the ring system would not even fit in the distance between Earth and the Moon. The seven main rings are labeled in the order in which they were discovered. From the planet outward, they are D, C, B, A, F, G and E.
The D ring is very faint and closest to Saturn. The main rings are A, B and C. The outermost ring, easily seen with Earth-based telescopes, is the A ring. The Cassini Division is the largest gap in the rings and separates the B ring from the A ring. Just outside the A ring is the narrow F ring, shepherded by tiny moons, Pandora and Prometheus. Beyond that are two much fainter rings named G and E. Saturn's diffuse E ring is the largest planetary ring in our solar system, extending from Mimas' orbit to Titan's orbit, about 1 million kilometers (621,370 miles).
The particles in Saturn's rings are composed primarily of water ice and range in size from microns to tens of meters. The rings show a tremendous amount of structure on all scales; some of this structure is related to gravitational interactions with Saturn's many moons, but much of it remains unexplained. One moonlet, Pan, actually orbits inside the A ring in a 330-kilometer-wide (200-mile) gap called the Encke Gap. The main rings (A, B and C) are less than 100 meters (300 feet) thick in most places, compared to their radial extent of 62,120 kilometers (38,600 miles). The main rings are much younger than the age of the solar system, perhaps only a few hundred million years old. They may have formed from the breakup of one of Saturn's moons or from a comet or meteor that was torn apart by Saturn's gravity.
Credit: NASA/JPL
https://science.nasa.gov/resource/saturns-rings-2/
#space #saturn #astrophotography #photography #science #astronomy #physics #nature #NASA #ESA #education

Alt...
This is an artist's concept of Saturn's rings and major icy moons.
Saturn's rings make up an enormous, complex structure. From edge-to-edge, the ring system would not even fit in the distance between Earth and the Moon. The seven main rings are labeled in the order in which they were discovered. From the planet outward, they are D, C, B, A, F, G and E.
Credit: NASA/JPL
SubTopic> Moons of Saturn
The Saturn system
teems with natural satellites, from planet-sized Titan to small oddballs, shaped like potatoes or ravioli.
Saturn has 274 confirmed moons in its orbit, far more than any other planet in our solar system. In March 2025, astronomers confirmed the discovery of 128 small moons around Saturn — adding to the already large moon count.
Saturn's moons range in size from larger than the planet Mercury – the giant moon Titan – to as small as a sports arena. The small moon Enceladus has a global ocean under a thick, icy shell. Scientists have identified both moons as high-priority science destinations for future deep space missions.
Surrounded by more than 60 known moons, Saturn is home to some of the most fascinating landscapes in our solar system. From the jets of water that spray from Enceladus to the methane lakes on smoggy Titan, the Saturn system is a rich source of scientific discovery and still holds many mysteries. The farthest planet from Earth discovered by the unaided human eye, Saturn has been known since ancient times. The planet is named for the Roman god of agriculture and wealth, who was also the father of Jupiter.
The following Link will take you to an interactive 3D api to explore the moon-system of Saturn:
https://eyes.nasa.gov/apps/solar-system/#/saturn/moons?embed=true
#space #saturn #astrophotography #photography #science #astronomy #physics #nature #NASA #ESA #education #apod

Alt...
Surrounded by more than 60 known moons, Saturn is home to some of the most fascinating landscapes in our solar system. From the jets of water that spray from Enceladus to the methane lakes on smoggy Titan, the Saturn system is a rich source of scientific discovery and still holds many mysteries. The farthest planet from Earth discovered by the unaided human eye, Saturn has been known since ancient times. The planet is named for the Roman god of agriculture and wealth, who was also the father of Jupiter.
The provided Link will take you to an interactive 3D api to explore the moon-system of Saturn
annotataed version of previews image
Dione and Rhea Ring Transit
* Image Credit & Copyright: Christopher Go
#space #saturn #astrophotography #photography #science #astronomy #physics #nature #NASA #ESA #education #apod

Alt...
annotataed version of previews image
Dione and Rhea Ring Transit
* Image Credit & Copyright: Christopher Go
2025 November 22
Dione and Rhea Ring Transit
* Image Credit & Copyright: Christopher Go
https://astro.christone.net/
Explanation:
Seen to the left of Saturn's banded planetary disk, small icy moons Dione and Rhea are caught passing in front of the gas giant's extensive ring system in this sharp telescopic snapshot. The remarkable image was recorded on November 20, when Saturn's rings were nearly edge-on when viewed from planet Earth. In fact, every 13 to 16 years the view from planet Earth aligns with Saturn's ring plane to produce a series of ring plane crossings. During a ring plane crossing, the interplanetary edge-on perspective makes the thin but otherwise bright rings seem to disappear. By November 23rd Saturn's rings will have reached a minimum angle for now, at their narrowest for viewing from planet Earth, but then start to widen again. Of course, Dione and Rhea orbit Saturn near the ring plane once every 2.7 and 4.5 days respectively, while the next series of Saturn ring plane crossings as seen from Earth will begin again in 2038.
https://science.nasa.gov/saturn/moons/dione/
https://science.nasa.gov/saturn/moons/rhea/
https://science.nasa.gov/resource/saturns-rings-2/
https://astro.christone.net/saturn/index.htm
https://science.nasa.gov/missions/hubble/hubble-views-saturn-ring-plane-crossing/
https://apod.nasa.gov/apod/fap/ap251116.html
https://science.nasa.gov/solar-system/whats-up-november-2025-skywatching-tips-from-nasa/
https://gizmodo.com/saturn-will-look-naked-in-the-night-sky-this-weekend-2000689525
https://science.nasa.gov/saturn/moons/
https://astro.christone.net/saturn/index.htm
https://apod.nasa.gov/apod/ap251122.html
#space #saturn #astrophotography #photography #science #astronomy #physics #nature #NASA #ESA #education #apod
 & Jerry Bonnell (UMCP)
NASA Official: Amber Straughn Specific rights apply.
NASA Web Privacy, Accessibility, Notices;
A service of: ASD at NASA / GSFC,
NASA Science Activation
& Michigan Tech. U.")
Alt...
2025 November 22
Dione and Rhea Ring Transit
* Image Credit & Copyright: Christopher Go
Explanation:
Seen to the left of Saturn's banded planetary disk, small icy moons Dione and Rhea are caught passing in front of the gas giant's extensive ring system in this sharp telescopic snapshot. The remarkable image was recorded on November 20, when Saturn's rings were nearly edge-on when viewed from planet Earth. In fact, every 13 to 16 years the view from planet Earth aligns with Saturn's ring plane to produce a series of ring plane crossings. During a ring plane crossing, the interplanetary edge-on perspective makes the thin but otherwise bright rings seem to disappear. By November 23rd Saturn's rings will have reached a minimum angle for now, at their narrowest for viewing from planet Earth, but then start to widen again. Of course, Dione and Rhea orbit Saturn near the ring plane once every 2.7 and 4.5 days respectively, while the next series of Saturn ring plane crossings as seen from Earth will begin again in 2038.
Authors & editors: Robert Nemiroff (MTU) & Jerry Bonnell (UMCP)
NASA Official: Amber Straughn Specific rights apply.
NASA Web Privacy, Accessibility, Notices;
A service of: ASD at NASA / GSFC,
NASA Science Activation
& Michigan Tech. U.
![[?]](https://files.mastodon.social/accounts/avatars/110/441/535/131/897/219/original/0ddf9d4dd12a5dee.png)
Scientists found the key to accurate Maya eclipse tables
Eclipse tables in the Dresden Codex were based on lunar tables and adjusted for slippage over time.
by Jennifer Ouellette
https://arstechnica.com/science/2025/11/study-how-the-maya-created-such-accurate-eclipse-tables/
Original article:
https://www.science.org/doi/10.1126/sciadv.adt9039
#books #old_manuscripts #astronomy

Alt...
Pages of the Dresden codex on eclipses .
The image shows several adjoining pages of the Dresden Codex, an ancient Maya manuscript. The pages are filled with dense Maya hieroglyphs, numbers, and symbols arranged in horizontal rows and vertical columns. Much of the imagery uses black and red ink on a cream-colored, weathered surface.
Across the pages are repeating patterns of dot-and-bar numerals, used in Maya calendrical calculations. Interspersed among the glyph blocks are stylized drawings of deities and serpent-like figures, characteristic of Maya cosmology. These particular pages are known for containing astronomical tables related to eclipses, and the highly structured numerical sequences suggest predictive calculations.
2025 November 20
3I/ATLAS: A View from Planet Earth
Image Credit & Copyright: Rolando Ligustri
https://www.instagram.com/rolandoligustri/
Explanation:
Now outbound after its perihelion or closest approach to the Sun on October 29, Comet 3I/ATLAS is only the third known interstellar object to pass through our fair Solar System. Its greenish coma and faint tails are seen against a background of stars in the constellation Virgo in this view from planet Earth, recorded with a small telescope on November 14. But this interstellar interloper is the subject of an on-going, unprecedented Solar System-wide observing campaign involving spacecraft and space telescopes from Earth orbit to the surface of Mars and beyond. And while the comet from another star-system has recently grown brighter, you'll still need a telescope if you want to see 3I/ATLAS from planet Earth. It's now above the horizon in November morning skies and will make its closest approach to Earth, a comfortable 270 million kilometers distant, around December 19.
https://science.nasa.gov/solar-system/comets/3i-atlas/
https://www.instagram.com/rolandoligustri/p/DRCsqxPDFHM/
https://apod.nasa.gov/apod/ap250809.html
https://science.nasa.gov/solar-system/comets/3i-atlas/comet-3i-atlas-image-gallery/
https://science.nasa.gov/solar-system/view-interstellar-comet-3i-atlas-through-nasas-multiple-lenses/
https://www.arxiv.org/abs/2510.25035
https://earthsky.org/space/new-interstellar-object-candidate-heading-toward-the-sun-a11pl3z/
https://theskylive.com/c2025n1-info
https://apod.nasa.gov/apod/ap251121.html
#space #comets #astrophotography #photography #science #astronomy #nature #NASA #ESA #apod
 & Jerry Bonnell (UMCP)
NASA Official: Amber Straughn Specific rights apply.
NASA Web Privacy, Accessibility, Notices;
A service of: ASD at NASA / GSFC,
NASA Science Activation
& Michigan Tech. U.")
Alt...
2025 November 20
3I/ATLAS: A View from Planet Earth
Image Credit & Copyright: Rolando Ligustri
Explanation:
Now outbound after its perihelion or closest approach to the Sun on October 29, Comet 3I/ATLAS is only the third known interstellar object to pass through our fair Solar System. Its greenish coma and faint tails are seen against a background of stars in the constellation Virgo in this view from planet Earth, recorded with a small telescope on November 14. But this interstellar interloper is the subject of an on-going, unprecedented Solar System-wide observing campaign involving spacecraft and space telescopes from Earth orbit to the surface of Mars and beyond. And while the comet from another star-system has recently grown brighter, you'll still need a telescope if you want to see 3I/ATLAS from planet Earth. It's now above the horizon in November morning skies and will make its closest approach to Earth, a comfortable 270 million kilometers distant, around December 19.
Authors & editors: Robert Nemiroff (MTU) & Jerry Bonnell (UMCP)
NASA Official: Amber Straughn Specific rights apply.
NASA Web Privacy, Accessibility, Notices;
A service of: ASD at NASA / GSFC,
NASA Science Activation
& Michigan Tech. U.
2025 November 20
Alnitak, Alnilam, Mintaka
* Image Credit & Copyright: Aygen Erkaslan
https://app.astrobin.com/u/a.erkaslan#gallery
Explanation:
Alnitak, Alnilam, and Mintaka are the bright bluish stars from east to west (upper right to lower left) along the diagonal in this cosmic vista. Otherwise known as the Belt of Orion, these three blue supergiant stars are hotter and much more massive than the Sun. They lie from 700 to 2,000 light-years away, born of Orion's well-studied interstellar clouds. In fact, clouds of gas and dust adrift in this region have some surprisingly familiar shapes, including the dark Horsehead Nebula and Flame Nebula near Alnitak at the upper right. The famous Orion Nebula itself is off the right edge of this colorful starfield. The telescopic frame spans almost 4 degrees on the sky.
http://stars.astro.illinois.edu/sow/alnitak.html
http://stars.astro.illinois.edu/sow/alnilam.html
http://stars.astro.illinois.edu/sow/mintaka.html
https://app.astrobin.com/u/a.erkaslan?i=6igdue#gallery
https://www.gb.nrao.edu/~rmaddale/Education/OrionTourCenter/optical.html
https://apod.nasa.gov/apod/ap200919.html
https://apod.nasa.gov/apod/ap250902.html
https://apod.nasa.gov/apod/ap251113.html
https://apod.nasa.gov/apod/ap120119.html
https://apod.nasa.gov/apod/ap251120.html
#space #nebula #astronomy #science #astrophotography #photography #nature #nebula #NASA #apod
 along the diagonal in this cosmic vista. Otherwise known as the Belt of Orion, these three blue supergiant stars are hotter and much more massive than the Sun. They lie from 700 to 2,000 light-years away, born of Orion's well-studied interstellar clouds. In fact, clouds of gas and dust adrift in this region have some surprisingly familiar shapes, including the dark Horsehead Nebula and Flame Nebula near Alnitak at the upper right. The famous Orion Nebula itself is off the right edge of this colorful starfield. The telescopic frame spans almost 4 degrees on the sky.
Authors & editors: Robert Nemiroff (MTU) & Jerry Bonnell (UMCP)
NASA Official: Amber Straughn Specific rights apply.
NASA Web Privacy, Accessibility, Notices;
A service of: ASD at NASA / GSFC,
NASA Science Activation
& Michigan Tech. U.")
Alt...
2025 November 20
Alnitak, Alnilam, Mintaka
* Image Credit & Copyright: Aygen Erkaslan
Explanation:
Alnitak, Alnilam, and Mintaka are the bright bluish stars from east to west (upper right to lower left) along the diagonal in this cosmic vista. Otherwise known as the Belt of Orion, these three blue supergiant stars are hotter and much more massive than the Sun. They lie from 700 to 2,000 light-years away, born of Orion's well-studied interstellar clouds. In fact, clouds of gas and dust adrift in this region have some surprisingly familiar shapes, including the dark Horsehead Nebula and Flame Nebula near Alnitak at the upper right. The famous Orion Nebula itself is off the right edge of this colorful starfield. The telescopic frame spans almost 4 degrees on the sky.
Authors & editors: Robert Nemiroff (MTU) & Jerry Bonnell (UMCP)
NASA Official: Amber Straughn Specific rights apply.
NASA Web Privacy, Accessibility, Notices;
A service of: ASD at NASA / GSFC,
NASA Science Activation
& Michigan Tech. U.
Annotated Hi-Res image for previews post.
Chamaeleon Dark Nebulas
* Image Credit & Copyright: Xinran Li & Houbo Zhou
https://apod.nasa.gov/apod/fap/ap251119.html
#space #nebula #astronomy #science #astrophotography #photography #nature #nebula #NASA #apod

Alt...
Annotated Hi-Res image for previews post.
The featured image shows a dark nebula complex involving thick dust appearing brown and making a big
Chamaeleon Dark Nebulas
* Image Credit & Copyright: Xinran Li & Houbo Zhou
Explanation:
Sometimes the dark dust of interstellar space has an angular elegance. Such is the case toward the far-south constellation of Chamaeleon. Normally too faint to see, dark dust is best known for blocking visible light from stars and galaxies behind it. In this 11.4-hour exposure, however, the dust is seen mostly in light of its own, with its strong red and near-infrared colors creating a brown hue. Contrastingly blue, a bright star Beta Chamaeleontis is visible on the upper right of the V, with the dust that surrounds it preferentially reflecting blue light from its primarily blue-white color. All of the pictured stars and dust occur in our own Milky Way Galaxy with one notable exception: a white spot just below Beta Chamaeleontis is the galaxy IC 3104 which lies far in the distance. Interstellar dust is mostly created in the cool atmospheres of giant stars and dispersed into space by stellar light, stellar winds, and stellar explosions such as supernovas.
2025 November 19
Chamaeleon Dark Nebulas
* Image Credit & Copyright: Xinran Li & Houbo Zhou
https://app.astrobin.com/u/Flying_Dutchman#gallery
Explanation:
Sometimes the dark dust of interstellar space has an angular elegance. Such is the case toward the far-south constellation of Chamaeleon. Normally too faint to see, dark dust is best known for blocking visible light from stars and galaxies behind it. In this 11.4-hour exposure, however, the dust is seen mostly in light of its own, with its strong red and near-infrared colors creating a brown hue. Contrastingly blue, a bright star Beta Chamaeleontis is visible on the upper right of the V, with the dust that surrounds it preferentially reflecting blue light from its primarily blue-white color. All of the pictured stars and dust occur in our own Milky Way Galaxy with one notable exception: a white spot just below Beta Chamaeleontis is the galaxy IC 3104 which lies far in the distance. Interstellar dust is mostly created in the cool atmospheres of giant stars and dispersed into space by stellar light, stellar winds, and stellar explosions such as supernovas.
https://en.wikipedia.org/wiki/Chamaeleon
https://en.wikipedia.org/wiki/Beta_Chamaeleontis
https://www.flickr.com/photos/hiroc/47807534932
http://www.werbeagentur.org/oldwexi/gallery.html
https://theskylive.com/sky/deepsky/ic3104-object
https://apod.nasa.gov/apod/ap180628.html
https://www.science.org/content/article/interstellar-dust-may-come-supernovae-after-all
https://en.wikipedia.org/wiki/List_of_stellar_explosion_types
https://en.wikipedia.org/wiki/Red_giant
https://astronomy.swin.edu.au/cosmos/d/Dust+Grain
https://apod.nasa.gov/apod/ap000318.html
https://science.nasa.gov/ems/07_infraredwaves/
https://apod.nasa.gov/apod/ap251119.html
#space #nebula #astronomy #science #astrophotography #photography #nature #nebula #NASA #apod
 & Jerry Bonnell (UMCP)
NASA Official: Amber Straughn Specific rights apply.
NASA Web Privacy, Accessibility, Notices;
A service of: ASD at NASA / GSFC,
NASA Science Activation
& Michigan Tech. U.")
Alt...
2025 November 19
The featured image shows a dark nebula complex involving thick dust appearing brown and making a big
Chamaeleon Dark Nebulas
* Image Credit & Copyright: Xinran Li & Houbo Zhou
Explanation:
Sometimes the dark dust of interstellar space has an angular elegance. Such is the case toward the far-south constellation of Chamaeleon. Normally too faint to see, dark dust is best known for blocking visible light from stars and galaxies behind it. In this 11.4-hour exposure, however, the dust is seen mostly in light of its own, with its strong red and near-infrared colors creating a brown hue. Contrastingly blue, a bright star Beta Chamaeleontis is visible on the upper right of the V, with the dust that surrounds it preferentially reflecting blue light from its primarily blue-white color. All of the pictured stars and dust occur in our own Milky Way Galaxy with one notable exception: a white spot just below Beta Chamaeleontis is the galaxy IC 3104 which lies far in the distance. Interstellar dust is mostly created in the cool atmospheres of giant stars and dispersed into space by stellar light, stellar winds, and stellar explosions such as supernovas.
Authors & editors: Robert Nemiroff (MTU) & Jerry Bonnell (UMCP)
NASA Official: Amber Straughn Specific rights apply.
NASA Web Privacy, Accessibility, Notices;
A service of: ASD at NASA / GSFC,
NASA Science Activation
& Michigan Tech. U.
Explore and compare the Milky Way band in Visible Light and Radio Light with GLEAMX-deepzoom:
https://gleamx-deepzoom.pages.dev/
CREDIT
International Centre for Radio Astronomy Research (ICRAR)
#space #galaxy #milkyway #astrophotography #photography #science #astronomy #nature #NASA #apod
")
Alt...
Screenshot of the GLEAMX-deepzoom webpage
CREDIT
International Centre for Radio Astronomy Research (ICRAR)
2025 November 18
The Galactic Plane: Radio Versus Visible
* Image Credit: Radio: S. Mantovanini & the GLEAM team
https://www.researchgate.net/profile/Silvia_Mantovanini
https://www.mwatelescope.org/science/galactic-science/gleam/
* Visible: Axel Mellinger (milkywaysky.com)
https://milkywaysky.com/contact.html
Explanation:
What does the Milky Way look like in radio waves? To better find out, GLEAM surveyed the central band of our galaxy in high resolution radio light as imaged by the Murchison Widefield Array in Australia. As the featured video slowly scrolls, radio light (71 - 231 MHz) is seen on the left and visible light -- from the same field -- on the right. Differences are so great because most objects glow differently in radio and visible light, and because visible light is stopped by nearby interstellar dust. These differences are particularly apparent in the direction toward the center of our galaxy, seen about a third of the way through. Among the many features that appear in the radio, bright red patches are usually supernova remnants of exploded stars, while areas colored blue are stellar nurseries filled with bright young stars.
https://www.mwatelescope.org/science/galactic-science/gleam/
https://www.mwatelescope.org/
https://www.icrar.org/gleam-x-galactic-plane/
https://www.curtin.edu.au/news/media-release/a-new-expansive-view-of-the-milky-way-reveals-our-galaxy-in-unprecedented-radio-colour/
https://science.nasa.gov/ems/05_radiowaves/
https://science.nasa.gov/ems/09_visiblelight/
https://apod.nasa.gov/apod/ap250209.html
https://apod.nasa.gov/apod/ap241124.html
https://apod.nasa.gov/apod/ap250708.html
https://apod.nasa.gov/apod/ap100831.html
https://apod.nasa.gov/apod/ap250414.html
https://en.wikipedia.org/wiki/Supernova_remnant
https://apod.nasa.gov/apod/ap251118.html
#space #galaxy #milkyway #astrophotography #photography #science #astronomy #nature #NASA #apod
Watch the watchers of 3I/ATLAS live in this solar-system 3D api and read more about their missions:
https://eyes.nasa.gov/apps/solar-system/#/home
#comets #astrophotography #photography #science #astronomy #nature #NASA #ESA

Alt...
Image of 3I/ATLAS live in this solar-system 3D api
url provided in main text.
3I/ATLAS has its closest approach to Mars on Oct. 3, 2025. Several Mars missions will attempt to study the comet as it flies by.
The comet may be detectable by various Mars spacecraft, including Mars Reconnaissance Orbiter, MAVEN, Trace Gas Orbiter and Mars Express, as well as the Mars rovers Perseverance and Curiosity.
Watch its approach live with this interactive 3D simulation api:
https://eyes.nasa.gov/apps/solar-system/#/c_2025_n1/events/mars_flyby?rate=3000&time=2025-10-03T03:59:09.564+00:00
#comets #astrophotography #photography #science #astronomy #nature #NASA #ESA
2025 November 17
Comet Lemmon's Wandering Tail
* Image Credit: Ignacio Fernández
https://www.instagram.com/igneis.nightscapes/
Explanation:
What has happened to Comet Lemmon's tail? The answer is blowing in the wind — the wind from the Sun in this case. This continuous outflow of charged particles from the Sun has been quite variable of late, as the Sun emits bursts of energy, CMEs, that push out and deflect charged particles emitted by the comet itself. The result is a blue hued ion tail for Comet C/2025 A6 (Lemmon) that is not only impressively intricate but takes some unusual turns. This long-duration composite image taken from Alfacar, Spain last month captured this inner Solar System ionic tumult. Comet Lemmon is now fading as it heads out away from the Earth and Sun and back into the outer Solar System.
https://en.wikipedia.org/wiki/C/2025_A6_(Lemmon)
https://apod.nasa.gov/apod/ap220125.html
https://theskylive.com/c2025a6-info
https://science.nasa.gov/sun/what-is-the-solar-wind/
https://apod.nasa.gov/apod/ap240818.html
https://science.nasa.gov/science-research/heliophysics/nasa-noaa-sun-reaches-maximum-phase-in-11-year-solar-cycle/
https://www.jpl.nasa.gov/nmp/st5/SCIENCE/cme.html
https://science.nasa.gov/earth/facts/
https://apod.nasa.gov/apod/fap/ap251117.html
#space #comets #astrophotography #photography #science #astronomy #nature #NASA #ESA #education #apod
 that is not only impressively intricate but takes some unusual turns. This long-duration composite image taken from Alfacar, Spain last month captured this inner Solar System ionic tumult. Comet Lemmon is now fading as it heads out away from the Earth and Sun and back into the outer Solar System.
Authors & editors: Robert Nemiroff (MTU) & Jerry Bonnell (UMCP)
NASA Official: Amber Straughn Specific rights apply.
NASA Web Privacy, Accessibility, Notices;
A service of: ASD at NASA / GSFC,
NASA Science Activation
& Michigan Tech. U.")
Alt...
2025 November 17
A starfield is shown above a mountain peak. Just above the mountain and extending up toward the upper right is a blue-tinted tail of a comet. The comet's head is just to the left of the peak.
Comet Lemmon's Wandering Tail
* Image Credit: Ignacio Fernández
Explanation:
What has happened to Comet Lemmon's tail? The answer is blowing in the wind — the wind from the Sun in this case. This continuous outflow of charged particles from the Sun has been quite variable of late, as the Sun emits bursts of energy, CMEs, that push out and deflect charged particles emitted by the comet itself. The result is a blue hued ion tail for Comet C/2025 A6 (Lemmon) that is not only impressively intricate but takes some unusual turns. This long-duration composite image taken from Alfacar, Spain last month captured this inner Solar System ionic tumult. Comet Lemmon is now fading as it heads out away from the Earth and Sun and back into the outer Solar System.
Authors & editors: Robert Nemiroff (MTU) & Jerry Bonnell (UMCP)
NASA Official: Amber Straughn Specific rights apply.
NASA Web Privacy, Accessibility, Notices;
A service of: ASD at NASA / GSFC,
NASA Science Activation
& Michigan Tech. U.
![[?]](https://ftp.ieji.de/accounts/avatars/114/329/869/160/467/389/original/92deb9a433cd6f2d.jpg)
2025-11-16
Each morning the Moon is ever closer to the Sun
and Orion is ever farther from the Sun.
M-x lun RET
_________
Orion is a winter constellation in the Northern Hemisphere; in early spring it will be high in the sky in the evening.
#ApparentDistance
#Astronomy
#Emacs
#MixingPeriodicPhenomena

Alt...
A sketch of the pre-dawn eastern sky with a waning Moon and Orion.
The Great Crossing
(Saturn's rings on the edge)
This movie sequence captures Saturn's rings during a ring plane crossing from the Cassini spacecraft's point of view. The movie begins with a view of the sunlit side of the rings. As the spacecraft speeds from south to north, the rings appear to tilt downward and collapse to a thin plane, and then open again to reveal the un-illuminated side of the ring plane, where sunlight filters through only dimly. The movie consists of 34 images taken over the course of 12 hours as Cassini pierced the ring plane. Six moons careen through the field of view during the sequence. The first large one is Enceladus, whose slanted motion from the upper left to center right nicely illustrates the inclination of its orbit with respect to the rings. The second large one, seen in the second half of the movie, is Mimas, going from right to left.
Saturn's rings are about 175,000 miles (282,000 km) across, but only about 3,200 feet (~1 km) thick. If you had a model of Saturn that wasCRED a meter stick wide (3 feet), its rings would be about 10,000 times thinner than a razor blade! Saturn and its rings would just fit in the distance between Earth and the Moon.
Saturn's rings probably formed when objects like comets, asteroids, or even moons broke up in orbit around Saturn due to Saturn's very strong gravity. The pieces of these objects kept colliding with each other and broke into even smaller pieces. These pieces gradually spread around Saturn to form its rings. The rings are thought to be short-lived compared to the age of the Solar System, meaning that if we lived at a very different time, we may not have seen rings around Saturn.
Saturn's rings are made of billions of pieces of ice, dust and rocks. (more in ALT-text)
CREDIT
NASA Jet Propulsion Laboratory,
https://coolcosmos.ipac.caltech.edu/ask/108-How-large-are-Saturn-s-rings-
#space #saturn #astrophotography #photography #science #astronomy #physics #nature #NASA #ESA #education #apod
2025 November 16
Crossing Saturn's Ring Plane
* Image Credit: NASA, ESA, JPL, ISS, Cassini Imaging Team
https://www.nasa.gov/
https://www.esa.int/
https://www.jpl.nasa.gov/
http://ciclops.org/iss/iss.php
http://ciclops.org/
* Processing: Fernando Garcia Navarro
Explanation:
If this is Saturn, where are the rings? When Saturn's "appendages" disappeared in 1612, Galileo did not understand why. Later that century, it became understood that Saturn's unusual protrusions were rings and that when the Earth crosses the ring plane, the edge-on rings will appear to disappear. This is because Saturn's rings are confined to a plane many times thinner, in proportion, than a razor blade. In modern times, the robotic Cassini spacecraft that orbited Saturn frequently crossed Saturn's ring plane during its mission to Saturn, from 2004 to 2017. A series of plane crossing images from 2005 February was dug out of the vast online Cassini raw image archive by interested Spanish amateur Fernando Garcia Navarro. Pictured here, digitally cropped and set in representative colors, is the striking result. Saturn's thin ring plane appears in blue, bands and clouds in Saturn's upper atmosphere appear in gold. Details of Saturn's rings can be seen in high dark shadows. The moons Dione and Enceladus appear as bumps in the rings.
https://asterisk.apod.com/viewtopic.php?f=9&t=18340&p=230228#p230227
https://slate.com/technology/2005/06/saturns-thin-blue-line.html
https://coolcosmos.ipac.caltech.edu/ask/108-How-large-are-Saturn-s-rings-
https://solarsystem.nasa.gov/cassini-raw-images/
https://science.nasa.gov/mission/cassini/
https://science.nasa.gov/mission/cassini/spacecraft/cassini-orbiter/
https://science.nasa.gov/mission/cassini/spacecraft/cassini-orbiter/
https://science.nasa.gov/saturn/moons/dione/
https://science.gsfc.nasa.gov/attic/huygensgcms/Shistory.htm
https://en.wikipedia.org/wiki/Galileo_Galilei
https://apod.nasa.gov/apod/ap251116.html
#space #saturn #astrophotography #photography #science #astronomy #physics #nature #NASA #ESA #education #apod
 & Jerry Bonnell (UMCP)
NASA Official: Amber Straughn Specific rights apply.")
Alt...
2025 November 16
The planet Saturn is shown as an orange orb with bands. A blue line with bumps runs across the middle -- which is the rings seen sideways. The bumps are small moons.
Crossing Saturn's Ring Plane
* Image Credit: NASA, ESA, JPL, ISS, Cassini Imaging Team
* Processing: Fernando Garcia Navarro
Explanation:
If this is Saturn, where are the rings? When Saturn's "appendages" disappeared in 1612, Galileo did not understand why. Later that century, it became understood that Saturn's unusual protrusions were rings and that when the Earth crosses the ring plane, the edge-on rings will appear to disappear. This is because Saturn's rings are confined to a plane many times thinner, in proportion, than a razor blade. In modern times, the robotic Cassini spacecraft that orbited Saturn frequently crossed Saturn's ring plane during its mission to Saturn, from 2004 to 2017. A series of plane crossing images from 2005 February was dug out of the vast online Cassini raw image archive by interested Spanish amateur Fernando Garcia Navarro. Pictured here, digitally cropped and set in representative colors, is the striking result. Saturn's thin ring plane appears in blue, bands and clouds in Saturn's upper atmosphere appear in gold. Details of Saturn's rings can be seen in high dark shadows. The moons Dione and Enceladus appear as bumps in the rings.
Authors & editors: Robert Nemiroff (MTU) & Jerry Bonnell (UMCP)
NASA Official: Amber Straughn Specific rights apply.
![[?]](https://cdn.masto.host/swisssocial/accounts/avatars/109/610/582/883/537/207/original/0e6a86a6c0df06cc.jpg)

#astronomy #astronomie #science #wissenschaft #wissen #knowledge
Unser Sonnensystem bewegt sich zu schnell
Messungen anhand von Radiodaten zeigen signifikante Abweichungen zum Standardmodell 🤓
https://www.scinexx.de/news/kosmos/unser-sonnensystem-bewegt-sich-zu-schnell/
Trapezium Zoom
Messier 42 (The Orion Nebula)
+ Distance: 1,500 light-years
+ Apparent Magnitude: 4.0
+ Constellation: Orion
+ Object Type: Nebula
+ Release Date: August 24, 2000
+ Science Release: Hubble Spies Brown Dwarfs in Nearby Stellar Nursery
Credit
Bryan Preston (STScI AVL)
https://science.nasa.gov/missions/hubble/hubble-spies-brown-dwarfs-in-nearby-stellar-nursery/
#space #nebula #astronomy #science #astrophotography #photography #nature #nebula #NASA #ESA
Messier 42 (The Orion Nebula)
* by Andrea Gianopoulos
You can spot Messier 42, better known as the Orion Nebula, with the unaided eye from a dark sky site.
Believed to be the cosmic fire of creation by the Maya of Mesoamerica, M42 blazes brightly in the constellation Orion. Popularly called the Orion Nebula, this stellar nursery has been known to many different cultures throughout human history. The nebula is only 1,500 light-years away, making it the closest large star-forming region to Earth and giving it a relatively bright apparent magnitude of 4. Because of its brightness and prominent location just below Orion’s belt, M42 can be spotted with the naked eye, while offering an excellent peek at stellar birth for those with telescopes. It is best observed during January.
The Mayan culture’s likening of the Orion Nebula to a cosmic fire of creation is very apt. The nebula is an enormous cloud of dust and gas where vast numbers of new stars are being forged. Its bright, central region is the home of four massive, young stars that shape the nebula. The four hefty stars are called the Trapezium because they are arranged in a trapezoidal pattern. Ultraviolet light unleashed by these stars is carving a cavity in the nebula and disrupting the growth of hundreds of smaller stars.
This stunning Hubble image offers the sharpest view of the Orion Nebula ever obtained. Created using 520 different Hubble exposures taken in multiple wavelengths of light, this mosaic contains over one billion pixels. Hubble imaged most of the nebula, but ground-based images were used to fill in the gaps in its observations. The orange color in the image can be attributed to hydrogen, green represents oxygen, and the red represents both sulfur and observations made in infrared light.
FYI:
https://science.nasa.gov/missions/hubble/hubble-panoramic-view-of-orion-nebula-reveals-thousands-of-stars/
https://science.nasa.gov/missions/hubble/hubble-discovery-of-runaway-star-yields-clues-to-breakup-of-multiple-star-system/
#space #nebula #astronomy #science #astrophotography #photography #nature #nebula #NASA #ESA
 and the Hubble Space Telescope Orion Treasury Project Team")
Alt...
This stunning Hubble image offers the sharpest view of the Orion Nebula ever obtained. Created using 520 different Hubble exposures taken in multiple wavelengths of light, this mosaic contains over one billion pixels. Hubble imaged most of the nebula, but ground-based images were used to fill in the gaps in its observations. The orange color in the image can be attributed to hydrogen, green represents oxygen, and the red represents both sulfur and observations made in infrared light.
Credit
NASA, ESA, M. Robberto (Space Telescope Science Institute/ESA) and the Hubble Space Telescope Orion Treasury Project Team
; and G. Schneider, E. Young, G. Rieke, A. Cotera, H. Chen, M. Rieke, R. Thompson (Steward Observatory, University of Arizona, Tucson, Ariz.) and NASA/ESA")
Alt...
Appearing like glistening precious stones, M42’s Trapezium cluster, named for the trapezoidal arrangement of its central massive stars, is seen in this infrared Hubble image. All of the members of the Trapezium were born together in this hotbed of star formation.
CREDIT
K.L. Luhman (Harvard-Smithsonian Center for Astrophysics, Cambridge, Mass.); and G. Schneider, E. Young, G. Rieke, A. Cotera, H. Chen, M. Rieke, R. Thompson (Steward Observatory, University of Arizona, Tucson, Ariz.) and NASA/ESA
 and another to reduce the brightness of the nebula, revealing brighter regions above and below the disk that betray the presence of the star (right). Because the disk is edge-on, its star is largely hidden, but the disk may be an embryonic planetary system in the making. Our solar system probably formed out of such a disk 4.5 billion years ago.
CREDIT
Mark McCaughrean (Max-Planck-Institute for Astronomy), C. Robert O'Dell (Rice University) and NASA")
Alt...
Resembling an interstellar Frisbee, the dark feature in these two Hubble images is a protoplanetary disk of dust seen edge-on around a newborn star in M42. The two images show the disk through two different sets of filters: one to probe the disk’s chemical composition (left) and another to reduce the brightness of the nebula, revealing brighter regions above and below the disk that betray the presence of the star (right). Because the disk is edge-on, its star is largely hidden, but the disk may be an embryonic planetary system in the making. Our solar system probably formed out of such a disk 4.5 billion years ago.
CREDIT
Mark McCaughrean (Max-Planck-Institute for Astronomy), C. Robert O'Dell (Rice University) and NASA
Hubble Spies Brown Dwarfs in Nearby Stellar Nursery
[...]
Appearing like glistening precious stones surrounding a setting of sparkling diamonds, more than 300 fledgling stars and brown dwarfs surround the brightest, most massive stars [center of picture] in Hubble's view of the Trapezium cluster's central region. All of the celestial objects in the Trapezium were born together in this hotbed of star formation. The cluster is named for the trapezoidal alignment of those central massive stars.
Brown dwarfs are gaseous objects with masses so low their cores never become hot enough to fuse hydrogen, the thermonuclear fuel stars like the Sun need to shine steadily. Instead, these gaseous objects fade and cool as they grow older. [...]
This finding, along with observations from ground-based telescopes, is further evidence that brown dwarfs, once considered exotic objects, are nearly as abundant as stars. The image and results appear in the Sept. 20 issue of the Astrophysical Journal.
The brown dwarfs are too dim to be seen in a visible-light image taken by the Hubble telescope's Wide Field and Planetary Camera 2 [picture at left]. This view also doesn't show the assemblage of infant stars seen in the near-infrared image. That's because the young stars are embedded in dense clouds of dust and gas. The Hubble telescope's near-infrared camera, the Near Infrared Camera and Multi-Object Spectrometer, penetrated those clouds to capture a view of those objects. The brown dwarfs are the faintest objects in the image. Surveying the cluster's central region, the Hubble telescope spied brown dwarfs with masses equaling 10 to 80 Jupiters. Researchers think there may be less massive brown dwarfs that are beyond the limits of Hubble's vision.
[...] (see more in ALT-text)
#space #nebula #astronomy #science #astrophot ography #photography #nature #nebula #NASA #ESA
![Probing deep within a neighborhood stellar nursery, NASA's Hubble Space Telescope uncovered a swarm of newborn brown dwarfs. The orbiting observatory's near-infrared camera revealed about 50 of these objects throughout the Orion Nebula's Trapezium cluster [image at right], about 1,500 light-years from Earth. Appearing like glistening precious stones surrounding a setting of sparkling diamonds, more than 300 fledgling stars and brown dwarfs surround the brightest, most massive stars [center of picture] in Hubble's view of the Trapezium cluster's central region. The brown dwarfs are too dim to be seen in an image taken by the Hubble telescope's visible-light camera [picture at left].
[...]
The near-infrared image was taken Jan. 17, 1998. Two near-infrared filters were used to obtain information on the colors of the stars at two wavelengths (1.1 and 1.6 microns). The Trapezium picture is 1 light-year across. This composite image was made from a "mosaic" of nine separate, but adjoining images. In this false-color image, blue corresponds to warmer, more massive stars, and red to cooler, less massive stars and brown dwarfs, and stars that are heavily obscured by dust.
The visible-light data were taken in 1994 and 1995.
Credit
* Near-infrared image: NASA; K.L. Luhman and G. Schneider, E. Young, G. Rieke, A. Cotera, H. Chen, M. Rieke, R. Thompson
* Visible-light image: NASA, C.R. O'Dell and S.K. Wong (Rice University)](https://files.defcon.social/dcsocial-s3/media_attachments/files/115/552/556/134/768/487/original/5241229082ac1174.jpg "Probing deep within a neighborhood stellar nursery, NASA's Hubble Space Telescope uncovered a swarm of newborn brown dwarfs. The orbiting observatory's near-infrared camera revealed about 50 of these objects throughout the Orion Nebula's Trapezium cluster [image at right], about 1,500 light-years from Earth. Appearing like glistening precious stones surrounding a setting of sparkling diamonds, more than 300 fledgling stars and brown dwarfs surround the brightest, most massive stars [center of picture] in Hubble's view of the Trapezium cluster's central region. The brown dwarfs are too dim to be seen in an image taken by the Hubble telescope's visible-light camera [picture at left].
[...]
The near-infrared image was taken Jan. 17, 1998. Two near-infrared filters were used to obtain information on the colors of the stars at two wavelengths (1.1 and 1.6 microns). The Trapezium picture is 1 light-year across. This composite image was made from a \"mosaic\" of nine separate, but adjoining images. In this false-color image, blue corresponds to warmer, more massive stars, and red to cooler, less massive stars and brown dwarfs, and stars that are heavily obscured by dust.
The visible-light data were taken in 1994 and 1995.
Credit
* Near-infrared image: NASA; K.L. Luhman and G. Schneider, E. Young, G. Rieke, A. Cotera, H. Chen, M. Rieke, R. Thompson
* Visible-light image: NASA, C.R. O'Dell and S.K. Wong (Rice University)")
Alt...
Probing deep within a neighborhood stellar nursery, NASA's Hubble Space Telescope uncovered a swarm of newborn brown dwarfs. The orbiting observatory's near-infrared camera revealed about 50 of these objects throughout the Orion Nebula's Trapezium cluster [image at right], about 1,500 light-years from Earth. Appearing like glistening precious stones surrounding a setting of sparkling diamonds, more than 300 fledgling stars and brown dwarfs surround the brightest, most massive stars [center of picture] in Hubble's view of the Trapezium cluster's central region. The brown dwarfs are too dim to be seen in an image taken by the Hubble telescope's visible-light camera [picture at left].
[...]
The near-infrared image was taken Jan. 17, 1998. Two near-infrared filters were used to obtain information on the colors of the stars at two wavelengths (1.1 and 1.6 microns). The Trapezium picture is 1 light-year across. This composite image was made from a "mosaic" of nine separate, but adjoining images. In this false-color image, blue corresponds to warmer, more massive stars, and red to cooler, less massive stars and brown dwarfs, and stars that are heavily obscured by dust.
The visible-light data were taken in 1994 and 1995.
Credit
* Near-infrared image: NASA; K.L. Luhman and G. Schneider, E. Young, G. Rieke, A. Cotera, H. Chen, M. Rieke, R. Thompson
* Visible-light image: NASA, C.R. O'Dell and S.K. Wong (Rice University)
Orion Nebula proplyd atlas
This atlas features 30 proplyds, or protoplanetary discs, that were recently discovered in the majestic Orion Nebula. Using the wide field channel on Hubble’s Advanced Camera for Surveys (ACS), astronomers discovered a total of 42 new discs that could be the seeds of planetary systems to come. Within the awe-inspiring, gaseous folds of Orion, researchers have identified two different types of discs around young and forming stars: those that lie close to the brightest star in the cluster (Theta 1 Orionis C) and those farther away from it. The bright star heats up the gas in the nearby discs, causing them to shine brightly. The discs that are farther away do not receive enough of the energetic radiation from the star to set the gas ablaze; thus, they can only be detected as dark silhouettes against the background of the bright nebula, as the dust that surrounds these discs absorbs background visible light. By studying these silhouetted discs, astronomers are better able to characterize the properties of the dust grains that are thought to bind together and possibly form planets like our own. In the brighter discs the excited material produces many glowing cusps, which all face the bright star, but from our point of view are randomly oriented through the nebula, so we see some edge on, and others face on, for instance. Other interesting features enhance the look of these captivating objects, such as emerging jets of matter and shock waves. The dramatic shock waves are formed when the stellar wind from the nearby massive star collides with the gas in the nebula, sculpting boomerang shapes or arrows or even, in the case of 181-825, a space jellyfish! [...] (see ALT-text)
Image Credit:
NASA, ESA, and L. Ricci (ESO)
https://science.nasa.gov/image-detail/orion-nebula-proplyd-atlas/
#space #nebula #astronomy #science #astrophotography #photography #nature #nebula #NASA #ESA
![Orion Nebula proplyd atlas
This atlas features 30 proplyds, or protoplanetary discs, that were recently discovered in the majestic Orion Nebula.
Image Credit:
NASA, ESA, and L. Ricci (ESO)
[...]
It is relatively rare to see visible images of proplyds, but the high resolution and sensitivity of Hubble and the Orion Nebula’s proximity to Earth allow for precise views of these potential planetary systems. This proplyd atlas is the first scientific outcome from the HST Treasury Program on the Orion Nebula.](https://files.defcon.social/dcsocial-s3/media_attachments/files/115/552/466/597/260/016/original/5e9edbed868bda03.jpg "Orion Nebula proplyd atlas
This atlas features 30 proplyds, or protoplanetary discs, that were recently discovered in the majestic Orion Nebula.
Image Credit:
NASA, ESA, and L. Ricci (ESO)
[...]
It is relatively rare to see visible images of proplyds, but the high resolution and sensitivity of Hubble and the Orion Nebula’s proximity to Earth allow for precise views of these potential planetary systems. This proplyd atlas is the first scientific outcome from the HST Treasury Program on the Orion Nebula.")
Alt...
Orion Nebula proplyd atlas
This atlas features 30 proplyds, or protoplanetary discs, that were recently discovered in the majestic Orion Nebula.
Image Credit:
NASA, ESA, and L. Ricci (ESO)
[...]
It is relatively rare to see visible images of proplyds, but the high resolution and sensitivity of Hubble and the Orion Nebula’s proximity to Earth allow for precise views of these potential planetary systems. This proplyd atlas is the first scientific outcome from the HST Treasury Program on the Orion Nebula.
2025 November 15
Andromeda and Friends
* Image Credit & Copyright: Piotr Czerski
https://app.astrobin.com/u/PiotrC#gallery
Explanation:
This magnificent extragalactic skyscape looks toward the Andromeda Galaxy, the closest large spiral galaxy to the Milky Way. It also accomplishes a Messier catalog trifecta by including Andromeda, cataloged as Messier 31 (M31), along with Messier 32 (M32), and Messier 110 (M110) in the same telescopic field of view. In this frame, M32 is just left of the Andromeda Galaxy's bright core with M110 below and to the right. M32 and M110 are both elliptical galaxies themselves and satellites of the larger spiral Andromeda. By combining 60 hours of broadband and narrowband image data, the deep telescopic view also reveals tantalizing details of dust lanes, young star clusters, and star-forming regions along Andromeda's spiral arms, and faint, foreground clouds of glowing hydrogen gas. For now, Andromeda and friends are some 2.5 million light-years from our own large spiral Milky Way.
https://app.astrobin.com/u/PiotrC?i=1y6644#gallery
https://science.nasa.gov/mission/hubble/science/explore-the-night-sky/hubble-messier-catalog/messier-31/
https://science.nasa.gov/mission/hubble/science/explore-the-night-sky/hubble-messier-catalog/messier-32/
https://science.nasa.gov/mission/hubble/science/explore-the-night-sky/hubble-messier-catalog/messier-110/
https://apod.nasa.gov/apod/fap/ap251115.html
#space #galaxy #astrophotography #photography #science #astronomy #nature #NASA #ESA #apod
, along with Messier 32 (M32), and Messier 110 (M110) in the same telescopic field of view. In this frame, M32 is just left of the Andromeda Galaxy's bright core with M110 below and to the right. M32 and M110 are both elliptical galaxies themselves and satellites of the larger spiral Andromeda. By combining 60 hours of broadband and narrowband image data, the deep telescopic view also reveals tantalizing details of dust lanes, young star clusters, and star-forming regions along Andromeda's spiral arms, and faint, foreground clouds of glowing hydrogen gas. For now, Andromeda and friends are some 2.5 million light-years from our own large spiral Milky Way.
Authors & editors: Robert Nemiroff (MTU) & Jerry Bonnell (UMCP)
NASA Official: Amber Straughn Specific rights apply.
NASA Web Privacy, Accessibility, Notices;
A service of: ASD at NASA / GSFC,
NASA Science Activation
& Michigan Tech. U.")
Alt...
2025 November 15
Andromeda and Friends
* Image Credit & Copyright: Piotr Czerski
Explanation:
This magnificent extragalactic skyscape looks toward the Andromeda Galaxy, the closest large spiral galaxy to the Milky Way. It also accomplishes a Messier catalog trifecta by including Andromeda, cataloged as Messier 31 (M31), along with Messier 32 (M32), and Messier 110 (M110) in the same telescopic field of view. In this frame, M32 is just left of the Andromeda Galaxy's bright core with M110 below and to the right. M32 and M110 are both elliptical galaxies themselves and satellites of the larger spiral Andromeda. By combining 60 hours of broadband and narrowband image data, the deep telescopic view also reveals tantalizing details of dust lanes, young star clusters, and star-forming regions along Andromeda's spiral arms, and faint, foreground clouds of glowing hydrogen gas. For now, Andromeda and friends are some 2.5 million light-years from our own large spiral Milky Way.
Authors & editors: Robert Nemiroff (MTU) & Jerry Bonnell (UMCP)
NASA Official: Amber Straughn Specific rights apply.
NASA Web Privacy, Accessibility, Notices;
A service of: ASD at NASA / GSFC,
NASA Science Activation
& Michigan Tech. U.
2025 November 13
Orion and the Running Man
* Image Credit & Copyright: R. Jay Gabany
https://www.cosmotography.com/index.html
Explanation:
Few cosmic vistas can excite the imagination like The Great Nebula in Orion. Visible as a faint, bland celestial smudge to the naked-eye, the nearest large star-forming region sprawls across this sharp colorful telescopic image. Designated M42 in the Messier Catalog, the Orion Nebula's glowing gas and dust surrounds hot, young stars. About 40 light-years across, M42 is at the edge of an immense interstellar molecular cloud only 1,500 light-years away that lies within the same spiral arm of our Milky Way galaxy as the Sun. Including dusty bluish reflection nebula NGC 1977, also known as the Running Man nebula at left in the frame, the natal nebulae represent only a small fraction of our galactic neighborhood's wealth of star-forming material. Within the well-studied stellar nursery, astronomers have also identified what appear to be numerous infant solar systems.
https://cosmotography.com/images/small_gabany_M42_2025.html
https://science.nasa.gov/asset/hubble/the-orion-nebulas-trapezium-cluster/
https://science.nasa.gov/mission/hubble/science/explore-the-night-sky/hubble-messier-catalog/messier-42/
https://en.wikipedia.org/wiki/Orion_molecular_cloud_complex
https://science.nasa.gov/image-detail/orion-nebula-proplyd-atlas/
https://science.nasa.gov/universe/
https://apod.nasa.gov/apod/ap251113.html
#space #nebula #astronomy #science #astrophotography #photography #nature #nebula #NASA #apod
 & Jerry Bonnell (UMCP)
NASA Official: Amber Straughn Specific rights apply.
NASA Web Privacy, Accessibility, Notices;
A service of: ASD at NASA / GSFC,
NASA Science Activation
& Michigan Tech. U.")
Alt...
2025 November 13
Orion and the Running Man
* Image Credit & Copyright: R. Jay Gabany
Explanation:
Few cosmic vistas can excite the imagination like The Great Nebula in Orion. Visible as a faint, bland celestial smudge to the naked-eye, the nearest large star-forming region sprawls across this sharp colorful telescopic image. Designated M42 in the Messier Catalog, the Orion Nebula's glowing gas and dust surrounds hot, young stars. About 40 light-years across, M42 is at the edge of an immense interstellar molecular cloud only 1,500 light-years away that lies within the same spiral arm of our Milky Way galaxy as the Sun. Including dusty bluish reflection nebula NGC 1977, also known as the Running Man nebula at left in the frame, the natal nebulae represent only a small fraction of our galactic neighborhood's wealth of star-forming material. Within the well-studied stellar nursery, astronomers have also identified what appear to be numerous infant solar systems.
Authors & editors: Robert Nemiroff (MTU) & Jerry Bonnell (UMCP)
NASA Official: Amber Straughn Specific rights apply.
NASA Web Privacy, Accessibility, Notices;
A service of: ASD at NASA / GSFC,
NASA Science Activation
& Michigan Tech. U.
2025 November 12
A Super Lunar Corona
* Image Credit & Copyright: Eric Houck
https://www.instagram.com/a_guy_named_eric/
Explanation:
What are those colorful rings around the Moon? A corona. Rings like this will sometimes appear when the Moon is seen through thin clouds. The effect is created by the diffraction of light around individual, similarly-sized water droplets in an intervening but mostly transparent cloud. Since light of different colors has different wavelengths, each color diffracts differently. Lunar coronae are one of the few color diffraction effects that can be easily seen with the unaided eye. The featured image of a lunar corona was captured around last week's full Super Moon from near Knight's Ferry, California, USA. To the right of the full Moon is the giant orange star Botein. Similar coronae that form around the Sun are typically harder to see because of the Sun's great brightness.
https://en.wikipedia.org/wiki/Corona_(optical_phenomenon)
https://www.atoptics.co.uk/blog/corona-formation/
https://en.wikipedia.org/wiki/Diffraction
https://www.youtube.com/shorts/-zSIty9q73E
https://science.nasa.gov/moon/
https://science.nasa.gov/ems/01_intro/
https://defcon.social/@grobi/114964072917217796
https://en.wikipedia.org/wiki/Delta_Arietis
https://apod.nasa.gov/apod/ap251112.html
#space #earth #moon #astrophotography #photography #science #astronomy #physics #nature #NASA #apod
 & Jerry Bonnell (UMCP)
NASA Official: Amber Straughn Specific rights apply.
NASA Web Privacy, Accessibility, Notices;
A service of: ASD at NASA / GSFC,
NASA Science Activation
& Michigan Tech. U.")
Alt...
2025 November 12
The Moon is pictured in the center. ARound the Moon are colorful rings. The rings are nearly circular but have gaps. This but structured clouds are seen around the scene and at the bottom of the frame.
A Super Lunar Corona
* Image Credit & Copyright: Eric Houck
Explanation:
What are those colorful rings around the Moon? A corona. Rings like this will sometimes appear when the Moon is seen through thin clouds. The effect is created by the diffraction of light around individual, similarly-sized water droplets in an intervening but mostly transparent cloud. Since light of different colors has different wavelengths, each color diffracts differently. Lunar coronae are one of the few color diffraction effects that can be easily seen with the unaided eye. The featured image of a lunar corona was captured around last week's full Super Moon from near Knight's Ferry, California, USA. To the right of the full Moon is the giant orange star Botein. Similar coronae that form around the Sun are typically harder to see because of the Sun's great brightness.
Authors & editors: Robert Nemiroff (MTU) & Jerry Bonnell (UMCP)
NASA Official: Amber Straughn Specific rights apply.
NASA Web Privacy, Accessibility, Notices;
A service of: ASD at NASA / GSFC,
NASA Science Activation
& Michigan Tech. U.
![[?]](https://o.mastodon.nz/accounts/avatars/109/521/605/731/610/544/original/1c9d9dffbbd19631.jpeg)

I’m always amazed when I remember that Olympus Mons (the tallest mountain in our solar system- on Mars) is so tall (27km above the surrounding terrain), but the average slope of the mountain is so shallow, that standing at the bottom of the mountain, its peak would be hidden behind the curvature of the planet.
Learned this a couple of years ago and it blows my mind. #space #mars #science #astronomy
Edit: Really did not expect this one to still be being boosted naturally 19h later… must blow others’ minds too (boosting again now myself cause it seems to have struck a chord).
Edit to add: I’ve since learned it’s also true for a lot of hills in the Scottish highlands too, but they’re nowhere near as big.