Search results for tag #education
![[?]](https://files.defcon.social/dcsocial-s3/accounts/avatars/113/208/344/507/078/943/original/014820ad22daee1c.jpg)
2002 October 3
V838 Mon: Mystery Star
A leading candidate for the most mysterious star found in recent times is variable star V838 Monocerotis. At a distance of about 8,000 light-years, V838 Mon was discovered to be in outburst in January of this year. Initially thought to be a familiar type of classical nova, astronomers quickly realized that instead, V838 Mon may be a totally new addition to the astronomical zoo. Observations indicate that the erupting star transformed itself over a period of months from a small under-luminous star a little hotter than the Sun, to a highly-luminous, cool supergiant star undergoing rapid and complex brightness changes. The transformation defies the conventional understanding of stellar life cycles. A most notable feature of V838 Mon is the "expanding" nebula which now appears to surround it. Seen above in two separate images from the South African Astronomical Observatory's 1 meter telescope, the nebula is probably a light echo from shells of formerly unseen material lost by the star during its previous evolution. Light-years in diameter, the shells progressively reflect the light from V838 Mon's outbursts, providing an opportunity to look back at the history of this remarkable star's behaviour.
Authors & editors: Robert Nemiroff (MTU) & Jerry Bonnell (USRA)
https://apod.nasa.gov/apod/ap021003.html
___
This data sonification of the star V838 Monocerotis, or V838 Mon, shows two Hubble images taken almost seven months apart. A pulse of light from the central star illuminates clouds of dust and gas surrounding V838 Mon.
https://science.nasa.gov/mission/hubble/multimedia/sonifications/
CREDIT
NASA, ESA, H.E. Bond (STScI) and The Hubble Heritage Team (STScI/AURA)
* Sonification: SYSTEM Sounds (M. Russo, A. Santaguida)
#space #star #sonification #sound #acoustic #astrophotography #photography #science #astronomy #nature #education #NASA
2020 December 16
Sonified: The Matter of the Bullet Cluster
* Image Credit: X-ray: NASA/CXC/SAO
* Optical: NASA/STScI, Magellan/U.Arizona
* Lensing Map: NASA/STScI, ESO WFI, Magellan/U.Arizona
* Sonification: NASA/CXC/SAO/K.Arcand, SYSTEM Sounds (M. Russo, A. Santaguida)
Explanation:
What's the matter with the Bullet Cluster? This massive cluster of galaxies (1E 0657-558) creates gravitational lens distortions of background galaxies in a way that has been interpreted as strong evidence for the leading theory: that dark matter exists within. Different analyses, though, indicate that a less popular alternative -- modifying gravity-- could explain cluster dynamics without dark matter, and provide a more likely progenitor scenario as well. Currently, the two scientific hypotheses are competing to explain the observations: it's invisible matter versus amended gravity. The duel is dramatic as a clear Bullet-proof example of dark matter would shatter the simplicity of modified gravity theories. The featured sonified image is a Hubble/Chandra/Magellan composite with red depicting the X-rays emitted by hot gas, and blue depicting the suggested separated dark matter distribution. The sonification assigns low tones to dark matter, mid-range frequencies to visible light, and high tones to X-rays. The battle over the matter in the Bullet cluster is likely to continue as more observations, computer simulations, and analyses are completed.
https://apod.nasa.gov/apod/ap201216.html
#space #cluster #sonification #sound #astrophotography #photography #science #astronomy #nature #education #NASA
RS Puppis
Pulsating RS Puppis, the brightest star in the image center, is some ten times more massive than our Sun and on average 15,000 times more luminous. In fact, RS Pup is a Cepheid variable star, a class of stars whose brightness is used to estimate distances to nearby galaxies as one of the first steps in establishing the cosmic distance scale. As RS Pup pulsates over a period of about 40 days, its regular changes in brightness are also seen along its surrounding nebula delayed in time, effectively a light echo. Using measurements of the time delay and angular size of the nebula, the known speed of light allows astronomers to geometrically determine the distance to RS Pup to be 6,500 light-years, with a remarkably small error of plus or minus 90 light-years. An impressive achievement for stellar astronomy, the echo-measured distance also more accurately establishes the true brightness of RS Pup, and by extension other Cepheid stars, improving the knowledge of distances to galaxies beyond the Milky Way.
Authors & editors:
Robert Nemiroff (MTU) & Jerry Bonnell (UMCP)
____
RS Puppis is a glittering star 200 times larger than our Sun and wreathed with dust reflecting starlight. Located about 6,500 light-years away, this star rhythmically brightens and dims over a six-week cycle. In this sonification, scientists represent data in the image as sound for a new, festive way of experiencing RS Puppis. Pitch is assigned based on direction from the center; as the circle travels inward, points at the top of the circle are mapped to higher notes and points near the bottom are mapped to lower notes.
[...]
More information in Alt-Text
CREDIT
NASA, ESA and Jesús Maíz Apellániz (Instituto de Astrofísica de Andalucía, Spain); Acknowledgment: Davide De Martin (ESA/Hubble); Sonification: SYSTEM Sounds (M. Russo, A. Santaguida)
#space #star #sonification #sound #acoustic #astrophotography #photography #science #astronomy #nature #education #NASA
2020 September 30
Sonified: Eagle Nebula Pillars
* Image Credit: NASA, ESA, & The Hubble Heritage Team (STScI/AURA)
* Sonification: NASA, CXC, SAO, K. Arcand, M. Russo & A. Santaguida
Explanation:
Yes, but have you ever experienced the Eagle Nebula with your ears ? The famous nebula, M16, is best known for the feast it gives your eyes, highlighting bright young stars forming deep inside dark towering structures. These light-years long columns of cold gas and dust are some 6,500 light-years distant toward the constellation of the Serpent (Serpens). Sculpted and eroded by the energetic ultraviolet light and powerful winds from M16's cluster of massive stars, the cosmic pillars themselves are destined for destruction. But the turbulent environment of star formation within M16, whose spectacular details are captured in this combined Hubble (visible) and Chandra (X-ray) image, is likely similar to the environment that formed our own Sun. In the featured video, listen for stars and dust sounding off as the line of sonification moves left to right, with vertical position determining pitch.
Authors & editors: Robert Nemiroff (MTU) & Jerry Bonnell (UMCP)
https://apod.nasa.gov/apod/ap200930.html
___
These pillars of gas and dust in the Eagle Nebula are regions of starbirth. The aptly named "Pillars of Creation" hide newborn stars in their wispy columns. Stretching roughly 4 to 5 light-years, the towers are a relatively small feature of the entire Eagle Nebula, which spans 70 by 55 light-years.
In the sonification, sounds are generated by moving horizontally across the image from left to right as seen in both visible and X-ray light. The vertical position of the recorded light controls the pitch. Particular attention is paid to the structure of the pillars, which can be heard as sweeps from low to high pitches and back.
#space #nebula #sonification #sound #acoustic #astrophotography #photography #science #astronomy #nature #education #NASA
Mice Galaxies
From Wikipedia, the free encyclopedia
NGC 4676, or the Mice Galaxies, are two spiral galaxies in the constellation Coma Berenices. About 290 million light-years distant, they have begun the process of colliding and merging. Their "mice" name refers to the long tails produced by tidal action—the relative difference between gravitational pulls on the near and far parts of each galaxy—known here as a galactic tide. It is a possibility that both galaxies, which are members of the Coma Cluster, have experienced collision, and will continue colliding until they coalesce.
The colors of the galaxies are peculiar. In NGC 4676A a core with some dark markings is surrounded by a bluish white remnant of spiral arms. The tail is unusual, starting out blue and terminating in a more yellowish color, despite the fact that the beginning of each arm in virtually every spiral galaxy starts yellow and terminates in a bluish color. NGC 4676B has a yellowish core and two arcs; arm remnants underneath are bluish as well.
The galaxies were photographed in 2002 by the Hubble Space Telescope. In the background of the Mice Galaxies, there are over 3000 galaxies, at distances up to 13 billion light-years.
By contributors to Wikimedia projects
----
The Mice Galaxies are a colliding pair of galaxies, that will eventually merge into a single galaxy. They’re located about 300 million light-years away in the constellation Coma Berenices. In this data sonification, scientists represented brightness with volume and pitch – brighter light is louder and lower pitched. The vertical position of objects in the image is used to control the pitch of sustained musical strings, and cymbals swell following the brightness of the galaxy cores. Listen for a cymbal crash played for the foreground star with diffraction spikes, too!
CREDIT
Please see the ALT-Text
#space #galaxy #sonification #sound #acoustic #astrophotography #photography #science #astronomy #nature #education #NASA
Earth's Song
by Maria-Jose Vinas Garcia
Suspended in the dark cosmos, Earth sings to itself in a high-pitched chorus of chirps and beeps. This song is a product of very low frequency radio waves generated by lightning strikes or excited electrons zipping through the Van Allen Belts, two vast swaths of radiation surrounding Earth. While ham radio operators have long detected this eerie planetary sound using inexpensive receivers, the recent recording by specially designed antennas on NASA's twin Van Allen Probes is one of the clearest examples ever captured. But could Earth's chorus be a siren song? The probes are now on a quest to find out whether these radio waves might be powering up otherwise harmless electrons in the Van Allen Belts, turning them into "killer electrons" capable of damaging satellites and astronauts. Watch the videos to hear and learn more about this rare recording.
https://svs.gsfc.nasa.gov/11073
Credits:
+ Science@NASA
NASA's Goddard Space Flight Center
+ Van Allen Belts image courtesy of NASA
+ T. Benesch and J. Carns
#space #earth #hamradio #audio #sound #acoustic #tech #science #astronomy #nature #education #NASA

Alt...
Suspended in the dark cosmos, Earth sings to itself in a high-pitched chorus of chirps and beeps. This song is a product of very low frequency radio waves generated by lightning strikes or excited electrons zipping through the Van Allen Belts, two vast swaths of radiation surrounding Earth. While ham radio operators have long detected this eerie planetary sound using inexpensive receivers, the recent recording by specially designed antennas on NASA's twin Van Allen Probes is one of the clearest examples ever captured. But could Earth's chorus be a siren song? The probes are now on a quest to find out whether these radio waves might be powering up otherwise harmless electrons in the Van Allen Belts, turning them into "killer electrons" capable of damaging satellites and astronauts. Watch the videos to hear and learn more about this rare recording.
Credits:
+ Science@NASA
NASA's Goddard Space Flight Center
+ Van Allen Belts image courtesy of NASA
+ T. Benesch and J. Carns
Earthquakes
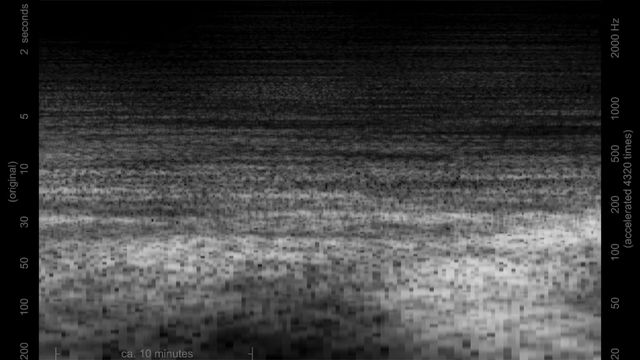
Seismograms of earthquakes have a particular, recognizable structure. The high-frequency first arrivals (primary, or P waves) are followed by lower-frequency secondary (S) waves, and then by the energetic, low-frequency surface waves, as in these examples. The lowest-frequency surface waves usually arrive earlier than the higher-frequency ones, which produces an upward glide (glissando) from low to high pitch.
The concluding part of the seismogram is the Coda, composed of numerous scattered waves arriving from different directions.
---
The catastrophic Tohoku earthquake occurred at 14:46 Japan standard time (05:46 UTC) on 11 March, 2011. The largest #earthquake ever recorded in Japan (magnitude Mw = 9.1), it occurred undersea, 70 km to the east of the Tohoku region, and lasted around 6 minutes. The earthquake triggered a tsunami that reached heights of up to 40 metres and travelled up to 10 km inland. Nearly 20 thousand casualties have been reported. The tsunami caused the #Fukushima Daiichi nuclear disaster, with the discharge of radioactive water in Fukushima and hundreds of thousands of residents evacuated.
This #seismogram is a recording of the Tohoku earthquake made thousands of kilometres away, at the Ireland Array seismic station IA003, Birr Castle Demesne, Co Offaly, Ireland. The seismogram shows the vertical component of the ground motion (up and down movements of the ground). The recording is accelerated by a factor of 4320, which increases the frequency of the signal by the same factor and brings it into the audible frequency range. The recording is then “stretched” by a factor of 40, so that the different waves can be distinguished in time and heard clearly.
Following the energetic arrivals of P, S, and surface wave, the long coda of the seismogram shows its own, original musical style, with moving, somber notes and harmonies.
Credit for Video and Article
David Stalling
https://www.soundsoftheearth.ie
#earth #tech #science #nature #education
Alt...
The catastrophic Tohoku earthquake occurred at 14:46 Japan standard time (05:46 UTC) on 11 March, 2011. The largest earthquake ever recorded in Japan (magnitude Mw = 9.1), it occurred undersea, 70 km to the east of the Tohoku region, and lasted around 6 minutes. The earthquake triggered a tsunami that reached heights of up to 40 metres and travelled up to 10 km inland. Nearly 20 thousand casualties have been reported. The tsunami caused the Fukushima Daiichi nuclear disaster, with the discharge of radioactive water in Fukushima and hundreds of thousands of residents evacuated.
--
This seismogram is a recording of the Tohoku earthquake made thousands of kilometres away, at the Ireland Array seismic station IA003, Birr Castle Demesne, Co Offaly, Ireland. The seismogram shows the vertical component of the ground motion (up and down movements of the ground). The recording is accelerated by a factor of 4320, which increases the frequency of the signal by the same factor and brings it into the audible frequency range. The recording is then “stretched” by a factor of 40, so that the different waves can be distinguished in time and heard clearly.
Following the energetic arrivals of P, S, and surface wave, the long coda of the seismogram shows its own, original musical style, with moving, somber notes and harmonies.
Credit for Video and Article
David Stalling (Ireland)
NGC 1300
The majestic barred spiral galaxy NGC 1300’s arms hold blue clusters of young stars, pink clouds of star formation, and dark lanes of dust. NGC 1300 is considered to be prototypical of barred spiral galaxies. Barred spirals differ from normal spiral galaxies in that the arms of the galaxy do not spiral all the way into the center, but are connected to the two ends of a straight bar of stars containing the nucleus at its center. In this image, blue and red supergiant stars, star clusters, and star-forming regions are well resolved by Hubble across the spiral arms, and dust lanes trace out fine structures in the disk and bar. Numerous more distant galaxies are visible in the background, and are seen even through the densest regions of NGC 1300.
To represent this image with sound, scientists assigned louder volume to brighter light. Light farther from the center is pitched higher as a counterclockwise radar scans across the galaxy. NGC 1300 resides nearly 70 million light-years away in the constellation Eridanus.
CREDITS:
+ NASA, ESA, and The Hubble Heritage Team (STScI/AURA)
+ Acknowledgment: P. Knezek (WIYN)
+ Sonification: SYSTEM Sounds (M. Russo, A. Santaguida)
#space #galaxy #sonification #sound #acoustic #astrophotography #photography #science #astronomy #nature #education #NASA
Sagittarius A* EHT Radio Sonification
This is a sonification — translation into sound — of the latest image from the Event Horizon Telescope of the supermassive black hole at the center of the Milky Way called Sagittarius A* (Sgr A*). Using a radar-like scan, the sonification begins at the 12 o'clock position and sweeps clockwise. Changes in volume represent the differences in brightness the EHT observed around the event horizon of Sgr A*. The material that is closer to the black hole and hence moving faster corresponds to higher frequencies of sound. This sonification was processed in a special way to allow a listener to hear the data in 3D stereo sound, in which the sounds seem to start directly ahead and then move clockwise to one ear then the other as the sweep is made.
About the Sound:
+ This is a radar-like scan, starting from 12 o'clock and moving clockwise.
+ The brightness controls the volume and the radial position controls the frequencies that are present.
+ The emission from material closer to the black hole (which orbits faster) is mapped to higher frequencies.
+ The sound is rendered in binaural audio. When listened to with headphones, the sound will appear to start directly in front of you and then move clockwise all the way around your head.
+ Listen for the three bright regions at about 1, 5, and 9 o'clock, as well as the very low tones indicating fainter light from outside the main ring.
For thread i looped the sonification three times.
+ Sonification Credit: NASA/CXC/SAO/K.Arcand, SYSTEM Sounds (M. Russo, A. Santaguida);
+ Image Credit: Radio: EHT Collaboration; X-ray (NASA/CXC/SAO); Infrared (NASA/HST/STScI)
More about the Center of our Galaxy in TOPIC> "Bull's Eye" into the Center of our Galaxy
https://defcon.social/@grobi/114498597554595255
https://chandra.harvard.edu/photo/2022/sgra/animations.html
#space #galaxy #sonification #sound #acoustic #astrophotography #photography #science #astronomy #nature #education #NASA
2006 July 22
Mira: The Wonderful Star
* Credit:
+ X-ray Image (left): M. Karovska (Harvard-Smithsonian CfA) et al., CXC / NASA
https://www.cfa.harvard.edu/
https://arxiv.org/abs/astro-ph/0503050
https://chandra.harvard.edu/
https://www.nasa.gov/
+ Illustration (right): M.Weiss(CXC)
Explanation:
To seventeenth century astronomers, Omicron Ceti or Mira was known as a wonderful star - a star whose brightness could change dramatically in the course of about 11 months. Modern astronomers now recognize an entire class of long period Mira-type variables as cool, pulsating, red giant stars, 700 or so times the diameter of the Sun. Only 420 light-years away, red giant Mira (Mira A, right) itself co-orbits with a companion star, a small white dwarf (Mira B). Mira B is surrounded by a disk of material drawn from the pulsating giant and in such a double star system, the white dwarf star's hot accretion disk is expected to produce some x-rays. But this sharp, false-color image from the Chandra Observatory also captures the cool giant star strongly flaring at x-ray energies, clearly separated from the x-ray emission of its companion's accretion disk. Placing your cursor over the Chandra x-ray image of Mira will reveal an artist's vision of this still wonderful interacting binary star system.
https://chandra.harvard.edu/photo/2005/mira/mira_hand.pdf
https://chandra.harvard.edu/photo/2005/mira/
https://apod.nasa.gov/apod/ap010121.html
https://apod.nasa.gov/apod/ap050312.html
https://chandra.harvard.edu/xray_astro/medxray.html
https://spider.seds.org/spider/Vars/mira.html
https://spider.seds.org/spider/Vars/mira.html
https://apod.nasa.gov/apod/ap060722.html
#space #binary_stars #astrophotography #photography #science #astronomy #physics #nature #NASA #education
: M. Karovska (Harvard-Smithsonian CfA) et al., CXC / NASA
+ Illustration (right): M.Weiss(CXC)
Explanation:
To seventeenth century astronomers, Omicron Ceti or Mira was known as a wonderful star - a star whose brightness could change dramatically in the course of about 11 months. Modern astronomers now recognize an entire class of long period Mira-type variables as cool, pulsating, red giant stars, 700 or so times the diameter of the Sun. Only 420 light-years away, red giant Mira (Mira A, right) itself co-orbits with a companion star, a small white dwarf (Mira B). Mira B is surrounded by a disk of material drawn from the pulsating giant and in such a double star system, the white dwarf star's hot accretion disk is expected to produce some x-rays. But this sharp, false-color image from the Chandra Observatory also captures the cool giant star strongly flaring at x-ray energies, clearly separated from the x-ray emission of its companion's accretion disk. Placing your cursor over the Chandra x-ray image of Mira will reveal an artist's vision of this still wonderful interacting binary star system.
Authors & editors: Robert Nemiroff (MTU) & Jerry Bonnell (USRA)
NASA Web Site Statements, Warnings, and Disclaimers
NASA Official: Jay Norris. Specific rights apply.
A service of: EUD at NASA / GSFC
& Michigan Tech. U.")
Alt...
2006 July 22
Mira: The Wonderful Star
* Credit:
+ X-ray Image (left): M. Karovska (Harvard-Smithsonian CfA) et al., CXC / NASA
+ Illustration (right): M.Weiss(CXC)
Explanation:
To seventeenth century astronomers, Omicron Ceti or Mira was known as a wonderful star - a star whose brightness could change dramatically in the course of about 11 months. Modern astronomers now recognize an entire class of long period Mira-type variables as cool, pulsating, red giant stars, 700 or so times the diameter of the Sun. Only 420 light-years away, red giant Mira (Mira A, right) itself co-orbits with a companion star, a small white dwarf (Mira B). Mira B is surrounded by a disk of material drawn from the pulsating giant and in such a double star system, the white dwarf star's hot accretion disk is expected to produce some x-rays. But this sharp, false-color image from the Chandra Observatory also captures the cool giant star strongly flaring at x-ray energies, clearly separated from the x-ray emission of its companion's accretion disk. Placing your cursor over the Chandra x-ray image of Mira will reveal an artist's vision of this still wonderful interacting binary star system.
Authors & editors: Robert Nemiroff (MTU) & Jerry Bonnell (USRA)
NASA Web Site Statements, Warnings, and Disclaimers
NASA Official: Jay Norris. Specific rights apply.
A service of: EUD at NASA / GSFC
& Michigan Tech. U.
, a highly evolved red giant star, and Mira B (left), a
white dwarf. To the right of the image is an artist‘s conception of this interacting star system. Mira A is
losing gas rapidly from its upper atmosphere via a stellar wind. Mira B exerts a gravitational tug that
creates a gaseous bridge between the two stars. Gas from the wind and bridge accumulates in an
accretion disk around Mira B and collisions between rapidly moving particles in the disk produce X-rays.
An unexpected X-ray outburst from Mira A was observed by Chandra. This outburst was likely an
indirect consequence of the internal turmoil in Mira A, which is now approaching the stage where its
nuclear fuel supply will be exhausted. It will eventually collapse to become a white dwarf, like Mira B.
Scale: X-ray image is 1.2 arcsec per side.
Chandra X-ray Observatory ACIS Image
CXC operated for NASA by the Smithsonian Astrophysical Observatory
Credit: X-ray: NASA/CXC/SAO/M. Karovska et al.; Illustration: CXC/M.Weiss")
Alt...
Illustration
Mira: A double star system 420 light years from Earth
Chandra‘s image shows Mira A (right), a highly evolved red giant star, and Mira B (left), a
white dwarf. To the right of the image is an artist‘s conception of this interacting star system. Mira A is
losing gas rapidly from its upper atmosphere via a stellar wind. Mira B exerts a gravitational tug that
creates a gaseous bridge between the two stars. Gas from the wind and bridge accumulates in an
accretion disk around Mira B and collisions between rapidly moving particles in the disk produce X-rays.
An unexpected X-ray outburst from Mira A was observed by Chandra. This outburst was likely an
indirect consequence of the internal turmoil in Mira A, which is now approaching the stage where its
nuclear fuel supply will be exhausted. It will eventually collapse to become a white dwarf, like Mira B.
Scale: X-ray image is 1.2 arcsec per side.
Chandra X-ray Observatory ACIS Image
CXC operated for NASA by the Smithsonian Astrophysical Observatory
Credit: X-ray: NASA/CXC/SAO/M. Karovska et al.; Illustration: CXC/M.Weiss
Detection of 19 lt-yr Long Bipolar Jets from Interacting Binary KX And
-- Stefan Ziegenbalg
Abstract
Bipolar jets with an apparent length of 20' ejected from KX And have been discovered in the first data release of the Northern Sky Narrowband Survey. KX And is a well-studied interacting binary with mass transfer through Roche lobe overflow at a distance of about 760 pc. However, the faint jets, which are visible in Hα light, have been overlooked in the past. With a known inclination of i ≈ 50° of the binary system, this leads to a true length of the jets of about 19 lt-yr (5.8 pc) in each direction.
https://ui.adsabs.harvard.edu/abs/2024RNAAS...8..289Z/graphics
#space #binary_stars #astrophotography #photography #science #astronomy #physics #nature #NASA #ESA #education
 in each direction.")
Alt...
Bipolar jets with an apparent length of 20' ejected from KX And have been discovered in the first data release of the Northern Sky Narrowband Survey. KX And is a well-studied interacting binary with mass transfer through Roche lobe overflow at a distance of about 760 pc. However, the faint jets, which are visible in Hα light, have been overlooked in the past. With a known inclination of i ≈ 50° of the binary system, this leads to a true length of the jets of about 19 lt-yr (5.8 pc) in each direction.
2025 December 5
The Bipolar Jets of KX Andromedae
* Image Credit & Copyright: Tim Schaeffer and the Deep Sky Collective
https://deepskycollective.com/kxand/steeve
https://deepskycollective.com/gallery
Explanation:
Blasting outward from variable star KX Andromedae, these stunning bipolar jets are 19 light-years long. Recently discovered, they are revealed in unprecedented detail in this deep telescopic image centered on KX And and composed from over 692 hours of combined image data. In fact, KX And is spectroscopically found to be an interacting binary star system consisting of a bright, hot B-type star with a swollen cool giant star as its co-orbiting, close companion. The stellar material from the cool giant star is likely being transferred to the hot B-type star through an accretion disk, with spectacular symmetric jets driven outward perpendicular to the disk itself. The known distance to KX And of 2,500 light-years, angular size of the jets, and estimated inclination of the accretion disk lead to the size estimate for each jet of an astonishing 19 light-years.
https://deepskycollective.com/gallery
https://app.astrobin.com/i/nllu5u?r=0
https://en.wikipedia.org/wiki/Binary_star#Spectroscopic_binaries
https://apod.nasa.gov/apod/ap060722.html
https://en.wikipedia.org/wiki/Accretion_disk
https://www.astroexplorer.org/details/rnaasad9478f1
https://apod.nasa.gov/apod/ap251205.html
#space #binary_stars #astrophotography #photography #science #astronomy #physics #nature #NASA #ESA #education #apod
 & Jerry Bonnell (UMCP)
NASA Official: Amber Straughn Specific rights apply.
NASA Web Privacy, Accessibility, Notices;
A service of: ASD at NASA / GSFC,
NASA Science Activation
& Michigan Tech. U.")
Alt...
2025 December 5
The Bipolar Jets of KX Andromedae
* Image Credit & Copyright: Tim Schaeffer and the Deep Sky Collective
Explanation:
Blasting outward from variable star KX Andromedae, these stunning bipolar jets are 19 light-years long. Recently discovered, they are revealed in unprecedented detail in this deep telescopic image centered on KX And and composed from over 692 hours of combined image data. In fact, KX And is spectroscopically found to be an interacting binary star system consisting of a bright, hot B-type star with a swollen cool giant star as its co-orbiting, close companion. The stellar material from the cool giant star is likely being transferred to the hot B-type star through an accretion disk, with spectacular symmetric jets driven outward perpendicular to the disk itself. The known distance to KX And of 2,500 light-years, angular size of the jets, and estimated inclination of the accretion disk lead to the size estimate for each jet of an astonishing 19 light-years.
Authors & editors: Robert Nemiroff (MTU) & Jerry Bonnell (UMCP)
NASA Official: Amber Straughn Specific rights apply.
NASA Web Privacy, Accessibility, Notices;
A service of: ASD at NASA / GSFC,
NASA Science Activation
& Michigan Tech. U.
TOPIC> Binary Star Systems
Bipolar jets from KX And
-- Stefan Ziegenbalg
https://www.simg.de/nebulae1/and-00.html
[...]
KX And (also known as BD+49 4045 and HD 218393) is a binary system consisting in a primary star with a spectral classification of B3pe and a cool giant of type K1III (Shenavrin et al., 2011). This secondary star, which has about half the mass of its companion (Floquet et al., 1995), is assumed to overflow its Roche lobe and thus transferring gas to the primary star (Floquet et al., 1989). The resulting accretion disk is responsible for the emission lines in the spectrum of the Be star.
A fraction of the material that falls to the accreting star is ejected in the form of jets which are aligned perpendicular to the accretion disk. The jets are likely ionized by the B3pe component of KX And. The elongated bubble, including the bright tip at the end of the northern jet is probably formed by the interaction of the ejected gas with interstellar medium and may also be ionized by kinetic energy.
The apparent length of the northern jet (with the bright tip) is 19.9′, while the southern jet is 20.3′ long. With a distance of 760±10 pc (Gaia Collaboration et al., 2023) and an inclination to the line of sight of the binary system (and thus of the accretion disc) of about 50° (Berdyugin et al., 1998), this corresponds to a true length of about 19 light-years (5.8 pc) for each jet.
[...]
#space #binary_stars #astrophotography #photography #science #astronomy #physics #nature #NASA #ESA #education
 at an apparent distance of about 1.8′ and the ejection rate seems to be vary strongly.
The bright point source in the main picture is KX And, which remains visible as a result of precise continuum subtraction because the brighter companion of this binary system is an emission-line star.")
Alt...
Bipolar jets ejected from KX And in Hα light without continuum. The image reveals fine details and shows two jets with an apparent length of about 20′, with the northern jet ending in a bright tip. That structure appears to be the outer end of a cigar-shaped shell. There is a diffuse structure in the southern jet, about 7′ from KX And. Both jets begin (becoming visible) at an apparent distance of about 1.8′ and the ejection rate seems to be vary strongly.
The bright point source in the main picture is KX And, which remains visible as a result of precise continuum subtraction because the brighter companion of this binary system is an emission-line star.
![[?]](https://files.allovertheplace.ca/accounts/avatars/113/978/333/189/657/013/original/82cfa6fe0d32498a.jpg)
How's everyone doing tonight?
I slept most of the day because of pain from #Fibromyalgia and #RheumatoidArthritis, so now I'll probably be up all night. I'm going to try and get some studying done even though my hands hurt. Really hoping the compression gloves I ordered come in soon.
Since college didn’t work out, I've been building my own self-paced curriculum:
- Bible courses from Christian Leaders Institute to deepen my understanding and support future nonprofit work
- Coding lessons with #Codecademy (codecademy.com)
- Braille proofreading training through NLS and NFB
- And if I get the scholarship, AI Software Engineering at Maestro AI University. I applied two days ago and should hear back within 14 days.
Tonight I'm deciding whether to focus on Christian Leaders coursework, coding, or Braille proofreading.
Tomorrow's my 34th birthday. My mom’s taking me out to eat, and later we're visiting a new ocularist to see about prosthetic eyes. My current ones no longer fit and cause pain, so they'll likely need to start me with conformers first. I'm dreading that part, but it’s time. I haven't been refitted for new ones since I was 16, a few months after a surgery to remove my extremely painful right eye.
#ChronicIllness #Disability #Blind #Accessibility #PainAwareness
#Learning #Education #Coding #Braille #AI #EdTech
#Christian #BibleStudy #Faith #Christianity
#NonprofitLeadership #DisabilityAdvocacy
#Birthday #Turning34 #Ocularist #Prosthetics
2025 December 3
Visualization: Near a Black Hole and Disk
* Illustration Credit: NASA's GSFC, J. Schnittman & B. Powell
https://www.nasa.gov/
https://www.nasa.gov/goddard/
https://science.gsfc.nasa.gov/sci/bio/jeremy.d.schnittman
https://science.gsfc.nasa.gov/sci/bio/brian.p.powell
* Text: Francis Reddy (U. Maryland, NASA's GSFC)
https://sedvme.gsfc.nasa.gov/sci/bio/francis.j.reddy
https://www.astro.umd.edu/
https://www.nasa.gov/goddard/
Explanation:
What would it look like to plunge into a monster black hole? This image from a supercomputer visualization shows the entire sky as seen from a simulated camera plunging toward a 4-million-solar-mass black hole, similar to the one at the center of our galaxy. The camera lies about 16 million kilometers from the black hole’s event horizon and is moving inward at 62% the speed of light. Thanks to gravity’s funhouse effects, the starry band of the Milky Way appears both as a compact loop at the top of this view and as a secondary image stretching across the bottom. Move the cursor over the image for additional explanations. Visualizations like this allow astronomers to explore black holes in ways not otherwise possible.
https://youtu.be/chhcwk4-esM
https://svs.gsfc.nasa.gov/14585/
https://apod.nasa.gov/apod/fap/ap220513.html
https://en.wikipedia.org/wiki/Event_horizon
https://www.grc.nasa.gov/www/k-12/Numbers/Math/Mathematical_Thinking/how_fast_is_the_speed.htm
https://apod.nasa.gov/apod/fap/ap101207.html
https://apod.nasa.gov/apod/fap/ap250702.html
https://science.nasa.gov/resource/the-milky-way-galaxy/https://apod.nasa.gov/htmltest/rjn_bht.html
https://science.nasa.gov/universe/black-holes/
https://apod.nasa.gov/apod/ap251203.html
#space #blackhole #astrophysics #astrophotography #photography #astronomy #science #nature #NASA #ESA #education #apod

Explanation:
What would it look like to plunge into a monster black hole? This image from a supercomputer visualization shows the entire sky as seen from a simulated camera plunging toward a 4-million-solar-mass black hole, similar to the one at the center of our galaxy. The camera lies about 16 million kilometers from the black hole’s event horizon and is moving inward at 62% the speed of light. Thanks to gravity’s funhouse effects, the starry band of the Milky Way appears both as a compact loop at the top of this view and as a secondary image stretching across the bottom. Move the cursor over the image for additional explanations. Visualizations like this allow astronomers to explore black holes in ways not otherwise possible.
Authors & editors: Robert Nemiroff (MTU) & Jerry Bonnell (UMCP)
NASA Official: Amber Straughn Specific rights apply.
NASA Web Privacy, Accessibility, Notices;
A service of: ASD at NASA / GSFC,
NASA Science Activation
& Michigan Tech. U.")
Alt...
2025 December 3
The illustration shows a structured orange band stretching horizontally across the imager. Connected in the middle is the Milky Way Galaxy curving up to the top of the frame. A second image of the orange band runs like a sine wave across the lower half of the frame, while a second image of the Milky Way galaxy appears just above it.
Visualization: Near a Black Hole and Disk
* Illustration Credit: NASA's GSFC, J. Schnittman & B. Powell;
* Text: Francis Reddy (U. Maryland, NASA's GSFC)
Explanation:
What would it look like to plunge into a monster black hole? This image from a supercomputer visualization shows the entire sky as seen from a simulated camera plunging toward a 4-million-solar-mass black hole, similar to the one at the center of our galaxy. The camera lies about 16 million kilometers from the black hole’s event horizon and is moving inward at 62% the speed of light. Thanks to gravity’s funhouse effects, the starry band of the Milky Way appears both as a compact loop at the top of this view and as a secondary image stretching across the bottom. Move the cursor over the image for additional explanations. Visualizations like this allow astronomers to explore black holes in ways not otherwise possible.
Authors & editors: Robert Nemiroff (MTU) & Jerry Bonnell (UMCP)
NASA Official: Amber Straughn Specific rights apply.
NASA Web Privacy, Accessibility, Notices;
A service of: ASD at NASA / GSFC,
NASA Science Activation
& Michigan Tech. U.
![[?]](https://files.mastodon.social/accounts/avatars/115/482/733/208/514/503/original/44f105522360436c.png)
TOPIC> Moons Of Saturn
Titan: Moon over Saturn
* Image Credit: NASA, JPL-Caltech, Space Science Institute
https://www.spacescience.org/index.php
https://www.jpl.nasa.gov/
https://www.nasa.gov/
Explanation:
Like Earth's moon, Saturn's largest moon Titan is locked in synchronous rotation with its planet. This mosaic of images recorded by the Cassini spacecraft in May of 2012 shows its anti-Saturn side, the side always facing away from the ringed gas giant. The only moon in the solar system with a dense atmosphere, Titan is the only solar system world besides Earth known to have standing bodies of liquid on its surface and an earthlike cycle of liquid rain and evaporation. Its high altitude layer of atmospheric haze is evident in the Cassini view of the 5,000 kilometer diameter moon over Saturn's rings and cloud tops. Near center is the dark dune-filled region known as Shangri-La. The Cassini-delivered Huygens probe rests below and left of center, after the most distant landing for a spacecraft from Earth.
https://photojournal.jpl.nasa.gov/catalog/PIA19642
https://science.nasa.gov/saturn/moons/titan/facts/
https://apod.nasa.gov/apod/ap141124.html
https://photojournal.jpl.nasa.gov/catalog/PIA20713
https://apod.nasa.gov/apod/ap150116.html
https://apod.nasa.gov/apod/ap161230.html
https://spaceplace.nasa.gov/all-about-saturn/en/
https://spaceplace.nasa.gov/search/Moons/
https://spaceplace.nasa.gov/craters/en/
>> see more in thread >>
#space #moon #titan #saturn #astrophotography #photography #science #nature #NASA #education
 & Jerry Bonnell (UMCP)
NASA Official: Amber Straughn Specific rights apply.
NASA Web Privacy Policy and Important Notices
A service of: ASD at NASA / GSFC,
NASA Science Activation
& Michigan Tech. U.")
Alt...
2025 May 3
Titan: Moon over Saturn
* Image Credit: NASA, JPL-Caltech, Space Science Institute
Explanation:
Like Earth's moon, Saturn's largest moon Titan is locked in synchronous rotation with its planet. This mosaic of images recorded by the Cassini spacecraft in May of 2012 shows its anti-Saturn side, the side always facing away from the ringed gas giant. The only moon in the solar system with a dense atmosphere, Titan is the only solar system world besides Earth known to have standing bodies of liquid on its surface and an earthlike cycle of liquid rain and evaporation. Its high altitude layer of atmospheric haze is evident in the Cassini view of the 5,000 kilometer diameter moon over Saturn's rings and cloud tops. Near center is the dark dune-filled region known as Shangri-La. The Cassini-delivered Huygens probe rests below and left of center, after the most distant landing for a spacecraft from Earth.
Authors & editors: Robert Nemiroff (MTU) & Jerry Bonnell (UMCP)
NASA Official: Amber Straughn Specific rights apply.
NASA Web Privacy Policy and Important Notices
A service of: ASD at NASA / GSFC,
NASA Science Activation
& Michigan Tech. U.
2025 November 30
The Surface of Titan from Huygens
* Image Credit: ESA, NASA, JPL, U. Arizona, Huygens Lander
https://www.esa.int/
https://www.nasa.gov/
https://www.jpl.nasa.gov/
https://www.lpl.arizona.edu/research/titan-outer-solar-system
https://www.esa.int/Science_Exploration/Space_Science/Cassini-Huygens/Huygens_spacecraft
Explanation:
If you could stand on Titan -- what would you see? The featured color view from Titan gazes across an unfamiliar and distant landscape on Saturn's largest moon. The scene was recorded by ESA's Huygens probe in 2005 after a 2.5-hour descent through a thick atmosphere of nitrogen laced with methane. Bathed in an eerie orange light at ground level, rocks strewn about the scene could well be composed of water and hydrocarbons frozen solid at an inhospitable temperature of negative 179 degrees C. The large light-toned rock below and left of center is only about 15 centimeters across and lies 85 centimeters away. The saucer-shaped spacecraft is believed to have penetrated about 15 centimeters into a place on Titan's surface that had the consistency of wet sand or clay. Huygen's batteries enabled the probe to take and transmit data for more than 90 minutes after landing. Titan's bizarre chemical environment may bear similarities to planet Earth's before life evolved.
https://www.esa.int/Science_Exploration/Space_Science/Cassini-Huygens/New_images_from_Titan#subhead2
https://en.wikipedia.org/wiki/Titan_(moon)
https://www.esa.int/
https://science.nasa.gov/mission/cassini-huygens/
https://apod.nasa.gov/apod/ap250119.html
https://www.jpl.nasa.gov/news/titans-surface-organics-surpass-oil-reserves-on-earth/
https://science.nasa.gov/mission/cassini-huygens/
https://www.esa.int/Science_Exploration/Space_Science/Cassini-Huygens/Life_on_Titan
https://apod.nasa.gov/apod/ap251129.html
#space #saturn #astrophotography #photography #science #astronomy #physics #nature #NASA #ESA #education #apod
 & Jerry Bonnell (UMCP)
NASA Official: Amber Straughn Specific rights apply.")
Alt...
2025 November 30
A strange orange landscape is shown. What appears to be light and dark orange rocks are strewn about. The landscape appears roughly flat all the way out to the orange sky and horizon.
The Surface of Titan from Huygens
* Image Credit: ESA, NASA, JPL, U. Arizona, Huygens Lander
Explanation:
If you could stand on Titan -- what would you see? The featured color view from Titan gazes across an unfamiliar and distant landscape on Saturn's largest moon. The scene was recorded by ESA's Huygens probe in 2005 after a 2.5-hour descent through a thick atmosphere of nitrogen laced with methane. Bathed in an eerie orange light at ground level, rocks strewn about the scene could well be composed of water and hydrocarbons frozen solid at an inhospitable temperature of negative 179 degrees C. The large light-toned rock below and left of center is only about 15 centimeters across and lies 85 centimeters away. The saucer-shaped spacecraft is believed to have penetrated about 15 centimeters into a place on Titan's surface that had the consistency of wet sand or clay. Huygen's batteries enabled the probe to take and transmit data for more than 90 minutes after landing. Titan's bizarre chemical environment may bear similarities to planet Earth's before life evolved.
Authors & editors: Robert Nemiroff (MTU) & Jerry Bonnell (UMCP)
NASA Official: Amber Straughn Specific rights apply.
![[?]](https://media.mstdn.io/mstdn-media/accounts/avatars/000/682/913/original/f8005c849d0d33fa.png)
Helping my wife grade some of her students' work. (9~14 years olds)
Just saw one where they just copy-pasted "AI" slop and obviously didn't even bother to read.
At this point I'm glad to find the ones full of grammar errors as at least that means it's not "AI".
Some I think deserve to be graded 0, but unfortunately as her subject (religion) is not obligatory curriculum, she is not allowed to.
2025 November 25
Comet Lemmon and the Milky Way
* Image Credit & Copyright: Lin Zixuan (Tsinghua U.)
https://www.tsinghua.edu.cn/en/
Explanation:
What did Comet Lemmon look like when it was at its best? One example is pictured here, featuring three celestial spectacles all at different distances. The closest spectacle is the snowcapped Meili Mountains, part of the Himalayas in China. The middle marvel is Comet Lemmon near its picturesque best early this month, showing not only a white dust tail trailing off to the right but its blue solar wind-distorted ion tail trailing off to the left. Far in the distance on the left is the magnificent central plane of our Milky Way Galaxy, featuring dark dust, red nebula, and including billions of Sun-like stars. Comet C/2025 A6 (Lemmon) is already fading as it heads back into the outer Solar System, while the Himalayan mountains will gradually erode over the next billion years. The Milky Way Galaxy, though, will live on -- forming new mountains and comets -- for many billions of years into the future.
https://www.youtube.com/watch?v=YylNkfmGNAQ
https://en.wikipedia.org/wiki/Himalayas
https://apod.nasa.gov/apod/ap251117.html
https://astronomy.swin.edu.au/cosmos/C/cometary+dust+tail
https://apod.nasa.gov/apod/ap240326.html
https://science.nasa.gov/resource/the-milky-way-galaxy/
https://apod.nasa.gov/apod/ap051004.html
https://apod.nasa.gov/apod/ap240214.html
https://science.nasa.gov/sun/
https://en.wikipedia.org/wiki/C/2025_A6_(Lemmon)
https://www.pbs.org/wgbh/nova/everest/earth/birth.html
https://apod.nasa.gov/apod/ap241105.html
https://apod.nasa.gov/apod/ap210303.html
https://apod.nasa.gov/apod/ap251125.html
#space #comets #astrophotography #photography #science #astronomy #nature #NASA #ESA #education #apod

Explanation:
What did Comet Lemmon look like when it was at its best? One example is pictured here, featuring three celestial spectacles all at different distances. The closest spectacle is the snowcapped Meili Mountains, part of the Himalayas in China. The middle marvel is Comet Lemmon near its picturesque best early this month, showing not only a white dust tail trailing off to the right but its blue solar wind-distorted ion tail trailing off to the left. Far in the distance on the left is the magnificent central plane of our Milky Way Galaxy, featuring dark dust, red nebula, and including billions of Sun-like stars. Comet C/2025 A6 (Lemmon) is already fading as it heads back into the outer Solar System, while the Himalayan mountains will gradually erode over the next billion years. The Milky Way Galaxy, though, will live on -- forming new mountains and comets -- for many billions of years into the future.
Authors & editors: Robert Nemiroff (MTU) & Jerry Bonnell (UMCP)
NASA Official: Amber Straughn Specific rights apply.")
Alt...
2025 November 25
A night skyscape is shown over snowcapped mountains. On the left is the band of the Milky Way Galaxy, while on the right is a bright comet with two tails -- a white tail going up and trailing to the right and a longer blue tail going up and trailing off to the left.
Comet Lemmon and the Milky Way
* Image Credit & Copyright: Lin Zixuan (Tsinghua U.)
Explanation:
What did Comet Lemmon look like when it was at its best? One example is pictured here, featuring three celestial spectacles all at different distances. The closest spectacle is the snowcapped Meili Mountains, part of the Himalayas in China. The middle marvel is Comet Lemmon near its picturesque best early this month, showing not only a white dust tail trailing off to the right but its blue solar wind-distorted ion tail trailing off to the left. Far in the distance on the left is the magnificent central plane of our Milky Way Galaxy, featuring dark dust, red nebula, and including billions of Sun-like stars. Comet C/2025 A6 (Lemmon) is already fading as it heads back into the outer Solar System, while the Himalayan mountains will gradually erode over the next billion years. The Milky Way Galaxy, though, will live on -- forming new mountains and comets -- for many billions of years into the future.
Authors & editors: Robert Nemiroff (MTU) & Jerry Bonnell (UMCP)
NASA Official: Amber Straughn Specific rights apply.
TOPIC> As Far As We Can See
2022 March 16
The Observable Universe
* Illustration Credit & Licence: Wikipedia, Pablo Carlos Budassi
https://commons.wikimedia.org/wiki/User:Unmismoobjetivo
https://commons.wikimedia.org/wiki/File:Extended_universe_logarithmic_illustration_(English_annotated).png
Explanation:
How far can you see? Everything you can see, and everything you could possibly see, right now, assuming your eyes could detect all types of radiations around you -- is the observable universe. In light, the farthest we can see comes from the cosmic microwave background, a time 13.8 billion years ago when the universe was opaque like thick fog. Some neutrinos and gravitational waves that surround us come from even farther out, but humanity does not yet have the technology to detect them. The featured image illustrates the observable universe on an increasingly compact scale, with the Earth and Sun at the center surrounded by our Solar System, nearby stars, nearby galaxies, distant galaxies, filaments of early matter, and the cosmic microwave background. Cosmologists typically assume that our observable universe is just the nearby part of a greater entity known as "the universe" where the same physics applies. However, there are several lines of popular but speculative reasoning that assert that even our universe is part of a greater multiverse where either different physical constants occur, different physical laws apply, higher dimensions operate, or slightly different-by-chance versions of our standard universe exist.
https://en.wikipedia.org/wiki/Observable_universe
https://science.nasa.gov/astrophysics/science-questions/how-do-matter-energy-space-and-time-behave-under-the-extraordinarily-diverse-conditions-of-the-cosmos/
https://apod.nasa.gov/apod/ap180305.html
http://www.atlasoftheuniverse.com/12lys.html
https://science.nasa.gov/solar-system/solar-system-facts/
https://en.wikipedia.org/wiki/Age_of_the_universe
https://wmap.gsfc.nasa.gov/universe/bb_tests_cmb.html
https://en.wikipedia.org/wiki/Logarithmic_scale
Authors & editors: Robert Nemiroff (MTU) & Jerry Bonnell (UMCP)
NASA Official: Phillip Newman Specific rights apply.
#space #universe #map #astronomy #astrophotography #photography #science #nature #NASA #education

Alt...
2022 March 16
The featured illustration depicts the entire visible universe and representations of most of the notable objects in it.
The Observable Universe
* Illustration Credit & Licence: Wikipedia, Pablo Carlos Budassi
Explanation:
How far can you see? Everything you can see, and everything you could possibly see, right now, assuming your eyes could detect all types of radiations around you -- is the observable universe. In light, the farthest we can see comes from the cosmic microwave background, a time 13.8 billion years ago when the universe was opaque like thick fog. Some neutrinos and gravitational waves that surround us come from even farther out, but humanity does not yet have the technology to detect them. The featured image illustrates the observable universe on an increasingly compact scale, with the Earth and Sun at the center surrounded by our Solar System, nearby stars, nearby galaxies, distant galaxies, filaments of early matter, and the cosmic microwave background. Cosmologists typically assume that our observable universe is just the nearby part of a greater entity known as "the universe" where the same physics applies. However, there are several lines of popular but speculative reasoning that assert that even our universe is part of a greater multiverse where either different physical constants occur, different physical laws apply, higher dimensions operate, or slightly different-by-chance versions of our standard universe exist.
2013 March 25
Planck Maps the Microwave Background
* Image Credit: European Space Agency, Planck Collaboration
https://www.esa.int/
https://www.esa.int/Science_Exploration/Space_Science/Planck
Explanation:
What is our universe made of? To help find out, ESA launched the Planck satellite to map, in unprecedented detail, slight temperature differences on the oldest surface known -- the background sky left billions of years ago when our universe first became transparent to light. Visible in all directions, this cosmic microwave background is a complex tapestry that could only show the hot and cold patterns observed were the universe to be composed of specific types of energy that evolved in specific ways. The results, reported last week, confirm again that most of our universe is mostly composed of mysterious and unfamiliar dark energy, and that even most of the remaining matter energy is strangely dark. Additionally, Planck data impressively peg the age of the universe at about 13.81 billion years, slightly older than that estimated by various other means including NASA's WMAP satellite, and the expansion rate at 67.3 (+/- 1.2) km/sec/Mpc, slightly lower than previous estimates. Some features of the above sky map remain unknown, such as why the temperature fluctuations seem to be slightly greater on one half of the sky than the other.
https://apod.nasa.gov/apod/ap130325.html
#space #universe #map #astronomy #astrophotography #photography #science #nature #NASA #ESA #education
 km/sec/Mpc, slightly lower than previous estimates. Some features of the above sky map remain unknown, such as why the temperature fluctuations seem to be slightly greater on one half of the sky than the other.
Authors & editors: Robert Nemiroff (MTU) & Jerry Bonnell (UMCP)
NASA Official: Phillip Newman Specific rights apply.
NASA Web Privacy Policy and Important Notices
A service of: ASD at NASA / GSFC
& Michigan Tech. U.")
Alt...
2013 March 25
Planck Maps the Microwave Background
* Image Credit: European Space Agency, Planck Collaboration
Explanation:
What is our universe made of? To help find out, ESA launched the Planck satellite to map, in unprecedented detail, slight temperature differences on the oldest surface known -- the background sky left billions of years ago when our universe first became transparent to light. Visible in all directions, this cosmic microwave background is a complex tapestry that could only show the hot and cold patterns observed were the universe to be composed of specific types of energy that evolved in specific ways. The results, reported last week, confirm again that most of our universe is mostly composed of mysterious and unfamiliar dark energy, and that even most of the remaining matter energy is strangely dark. Additionally, Planck data impressively peg the age of the universe at about 13.81 billion years, slightly older than that estimated by various other means including NASA's WMAP satellite, and the expansion rate at 67.3 (+/- 1.2) km/sec/Mpc, slightly lower than previous estimates. Some features of the above sky map remain unknown, such as why the temperature fluctuations seem to be slightly greater on one half of the sky than the other.
Authors & editors: Robert Nemiroff (MTU) & Jerry Bonnell (UMCP)
NASA Official: Phillip Newman Specific rights apply.
NASA Web Privacy Policy and Important Notices
A service of: ASD at NASA / GSFC
& Michigan Tech. U.
Planck finds no new evidence for cosmic anomalies
Science & Exploration
06/06/2019
ESA’s Planck satellite has found no new evidence for the puzzling cosmic anomalies that appeared in its temperature map of the Universe. The latest study does not rule out the potential relevance of the anomalies but they do mean astronomers must work even harder to understand the origin of these puzzling features.
Planck’s latest results come from an analysis of the polarisation of the Cosmic Microwave Background (CMB) radiation – the most ancient light in cosmic history, released when the Universe was just 380 000 years old.
The satellite’s initial analysis, which was made public in 2013, concentrated on the temperature of this radiation across the sky. This allows astronomers to investigate the origin and evolution of the cosmos. While it mostly confirmed the standard picture of how our Universe evolves, Planck’s first map also revealed a number of anomalies that are difficult to explain within the standard model of cosmology.
The anomalies are faint features on the sky that appear at large angular scales. They are definitely not artefacts produced by the behaviour of the satellite or the data processing, but they are faint enough that they could be statistical flukes – fluctuations which are extremely rare but not entirely ruled out by the standard model.
Alternatively, the anomalies might be a sign of ‘new physics’, the term used for as-yet unrecognised natural processes that would extend the known laws of physics.
Read more:
>>> https://www.esa.int/Science_Exploration/Space_Science/Planck/Planck_finds_no_new_evidence_for_cosmic_anomalies
Credit:
ESA/Planck Science Exploration
#space #universe #map #astronomy #astrophotography #photography #science #nature #NASA #ESA #education
Alt...
Planck finds no new evidence for cosmic anomalies
Science & Exploration
06/06/2019
ESA’s Planck satellite has found no new evidence for the puzzling cosmic anomalies that appeared in its temperature map of the Universe. The latest study does not rule out the potential relevance of the anomalies but they do mean astronomers must work even harder to understand the origin of these puzzling features.
Planck’s latest results come from an analysis of the polarisation of the Cosmic Microwave Background (CMB) radiation – the most ancient light in cosmic history, released when the Universe was just 380 000 years old.
The satellite’s initial analysis, which was made public in 2013, concentrated on the temperature of this radiation across the sky. This allows astronomers to investigate the origin and evolution of the cosmos. While it mostly confirmed the standard picture of how our Universe evolves, Planck’s first map also revealed a number of anomalies that are difficult to explain within the standard model of cosmology.
The anomalies are faint features on the sky that appear at large angular scales. They are definitely not artefacts produced by the behaviour of the satellite or the data processing, but they are faint enough that they could be statistical flukes – fluctuations which are extremely rare but not entirely ruled out by the standard model.
Credit:
ESA/Planck Science Exploration

Alt...
..
The timeline in the upper part of the illustration shows an artistic view of the evolution of the cosmos on large scales. The processes depicted range from inflation, the brief era of accelerated expansion that the Universe underwent when it was a tiny fraction of a second old, to the release of the CMB, the oldest light in our Universe, imprinted on the sky when the cosmos was just 380 000 years old; and from the ‘Dark Ages’ to the birth of the first stars and galaxies, which reionised the Universe when it was a few hundred million years old, all the way to the present time.
Tiny quantum fluctuations generated during the inflationary epoch are the seeds of future structure: the stars and galaxies of today. After the end of inflation, dark matter particles started to clump around these cosmic seeds, slowly building a cosmic web of structures. Later, after the release of the CMB, normal matter started to fall into these structures, eventually giving rise to stars and galaxies.
The inserts below show a zoomed-in view on some of the microscopic processes taking place during cosmic history: from the tiny fluctuations generated during inflation, to the dense soup of light and particles that filled the early Universe; from the last scattering of light off electrons, which gave rise to the CMB and its polarisation, to the reionisation of the Universe, caused by the first stars and galaxies, which induced additional polarisation on the CMB.
 polarization amplitude as observed by ESA’s Planck satellite. While fluctuations in the CMB are present and were observed by Planck down to very small angular scales, these images have been filtered to show mostly the signal detected on fairly large scales in the sky, around 5 degrees – as a comparison, the full Moon spans about half a degree.
On these large scales, a number of anomalies are observed in the CMB temperature – these are features that are difficult to explain within the standard model of cosmology, which relies on the assumption that the Universe, on large scales, has the same properties when observed in all directions.
The most serious anomaly is a deficit in the signal observed on scales around 5 degrees, which is about ten per cent weaker than predicted. Other anomalous traits are a significant discrepancy of the signal as observed in the two opposite hemispheres of the sky and a so-called 'cold spot' – a large, low-temperature spot with an unusually steep temperature profile (the location of this spot is also outlined in the lower right).
A comparison between the top map, showing the total Planck measurement – comprising both signal and noise – with the bottom map, showing only the noise, indicates that some anomalous features may be present, such as for example a power asymmetry between the two hemispheres, but they are statistically unconvincing.")
Alt...
Map of the cosmic microwave background (CMB) polarization amplitude as observed by ESA’s Planck satellite. While fluctuations in the CMB are present and were observed by Planck down to very small angular scales, these images have been filtered to show mostly the signal detected on fairly large scales in the sky, around 5 degrees – as a comparison, the full Moon spans about half a degree.
On these large scales, a number of anomalies are observed in the CMB temperature – these are features that are difficult to explain within the standard model of cosmology, which relies on the assumption that the Universe, on large scales, has the same properties when observed in all directions.
The most serious anomaly is a deficit in the signal observed on scales around 5 degrees, which is about ten per cent weaker than predicted. Other anomalous traits are a significant discrepancy of the signal as observed in the two opposite hemispheres of the sky and a so-called 'cold spot' – a large, low-temperature spot with an unusually steep temperature profile (the location of this spot is also outlined in the lower right).
A comparison between the top map, showing the total Planck measurement – comprising both signal and noise – with the bottom map, showing only the noise, indicates that some anomalous features may be present, such as for example a power asymmetry between the two hemispheres, but they are statistically unconvincing.
 temperature as observed by ESA’s Planck satellite. While fluctuations in the CMB are present and were observed by Planck down to very small angular scales, these images have been filtered to show mostly the signal detected on fairly large scales in the sky, around 5 degrees and larger – as a comparison, the full Moon spans about half a degree.
On these large scales, a number of anomalies are observed in the CMB temperature – these are features that are difficult to explain within the standard model of cosmology, which relies on the assumption that the Universe, on large scales, has the same properties when observed in all directions.
The most serious anomaly is a deficit in the signal observed on scales around 5 degrees, which is about ten per cent weaker than predicted. Other anomalous traits are a significant discrepancy of the signal as observed in the two opposite hemispheres of the sky (the two hemispheres are outlined by the large, roughly u-shaped curve in the image, the northern one being at the centre) and a so-called 'cold spot' – a large, low-temperature spot with an unusually steep temperature profile (also outlined in the lower right).
A comparison between the top map, showing the total Planck measurement – comprising both signal and noise – with the bottom map, showing only the noise, indicates that the anomalous features are clearly not artefacts as they are indeed present in the signal and not in the noise.")
Alt...
Map of the cosmic microwave background (CMB) temperature as observed by ESA’s Planck satellite. While fluctuations in the CMB are present and were observed by Planck down to very small angular scales, these images have been filtered to show mostly the signal detected on fairly large scales in the sky, around 5 degrees and larger – as a comparison, the full Moon spans about half a degree.
On these large scales, a number of anomalies are observed in the CMB temperature – these are features that are difficult to explain within the standard model of cosmology, which relies on the assumption that the Universe, on large scales, has the same properties when observed in all directions.
The most serious anomaly is a deficit in the signal observed on scales around 5 degrees, which is about ten per cent weaker than predicted. Other anomalous traits are a significant discrepancy of the signal as observed in the two opposite hemispheres of the sky (the two hemispheres are outlined by the large, roughly u-shaped curve in the image, the northern one being at the centre) and a so-called 'cold spot' – a large, low-temperature spot with an unusually steep temperature profile (also outlined in the lower right).
A comparison between the top map, showing the total Planck measurement – comprising both signal and noise – with the bottom map, showing only the noise, indicates that the anomalous features are clearly not artefacts as they are indeed present in the signal and not in the noise.
2011 June 14
The Universe Nearby
* Credit: 2MASS, T. H. Jarrett, J. Carpenter, & R. Hurt
https://www.ipac.caltech.edu/2mass/
Explanation:
What does the universe nearby look like? This plot shows nearly 50,000 galaxies in the nearby universe detected by the Two Micron All Sky Survey (2MASS) in infrared light. The resulting image is anincredible tapestry of galaxies that provides limits on how the universe formed and evolved. The dark band across the image center is blocked by dust in the plane of our own Milky Way Galaxy. Away from the Galactic plane, however, each dot represents a galaxy, color coded to indicate distance. Bluer dots represent the nearer galaxies in the 2MASS survey, while redder dots indicating the more distant survey galaxies that lie at a redshift near 0.1. Named structures are annotated around the edges. Many galaxies are gravitationally bound together to form clusters, which themselves are loosely bound into superclusters, which in turn are sometimes seen to align over even larger scale structures.
https://apod.nasa.gov/apod/ap110614.html
#space #universe #map #astronomy #astrophotography #photography #science #nature #NASA #ESA #education
 in infrared light. The resulting image is anincredible tapestry of galaxies that provides limits on how the universe formed and evolved. The dark band across the image center is blocked by dust in the plane of our own Milky Way Galaxy. Away from the Galactic plane, however, each dot represents a galaxy, color coded to indicate distance. Bluer dots represent the nearer galaxies in the 2MASS survey, while redder dots indicating the more distant survey galaxies that lie at a redshift near 0.1. Named structures are annotated around the edges. Many galaxies are gravitationally bound together to form clusters, which themselves are loosely bound into superclusters, which in turn are sometimes seen to align over even larger scale structures.
Authors & editors: Robert Nemiroff (MTU) & Jerry Bonnell (UMCP)
NASA Official: Phillip Newman Specific rights apply.
NASA Web Privacy Policy and Important Notices
A service of: ASD at NASA / GSFC
& Michigan Tech. U.")
Alt...
2011 June 14
The Universe Nearby
* Credit: 2MASS, T. H. Jarrett, J. Carpenter, & R. Hurt
Explanation:
What does the universe nearby look like? This plot shows nearly 50,000 galaxies in the nearby universe detected by the Two Micron All Sky Survey (2MASS) in infrared light. The resulting image is anincredible tapestry of galaxies that provides limits on how the universe formed and evolved. The dark band across the image center is blocked by dust in the plane of our own Milky Way Galaxy. Away from the Galactic plane, however, each dot represents a galaxy, color coded to indicate distance. Bluer dots represent the nearer galaxies in the 2MASS survey, while redder dots indicating the more distant survey galaxies that lie at a redshift near 0.1. Named structures are annotated around the edges. Many galaxies are gravitationally bound together to form clusters, which themselves are loosely bound into superclusters, which in turn are sometimes seen to align over even larger scale structures.
Authors & editors: Robert Nemiroff (MTU) & Jerry Bonnell (UMCP)
NASA Official: Phillip Newman Specific rights apply.
NASA Web Privacy Policy and Important Notices
A service of: ASD at NASA / GSFC
& Michigan Tech. U.
2023 July 5
A Map of the Observable Universe
* Image Credit & Copyright: B. Ménard & N. Shtarkman; Data: SDSS, Planck, JHU, Sloan, NASA, ESA
Explanation:
What if you could see out to the edge of the observable universe? You would see galaxies, galaxies, galaxies, and then, well, quasars, which are the bright centers of distant galaxies. To expand understanding of the very largest scales that humanity can see, a map of the galaxies and quasars found by the Sloan Digital Sky Survey from 2000 to 2020 -- out to near the edge of the observable universe -- has been composed. Featured here, one wedge from this survey encompasses about 200,000 galaxies and quasars out beyond a look-back time of 12 billion years and cosmological redshift 5. Almost every dot in the nearby lower part of the illustration represents a galaxy, with redness indicating increasing redshift and distance. Similarly, almost every dot on the upper part represents a distant quasar, with blue-shaded dots being closer than red. Clearly shown among many discoveries, gravity between galaxies has caused the nearby universe to condense and become increasingly more filamentary than the distant universe.
!>> https://mapoftheuniverse.net/
https://apod.nasa.gov/apod/ap230705.html
#space #universe #map #astronomy #astrophotography #photography #science #nature #NASA #ESA #education
 & Jerry Bonnell (UMCP)
NASA Official: Phillip Newman Specific rights apply.")
Alt...
2023 July 5
A map of the observable universe is illustrated in a wedge with the the Earth on the bottom and the universe fanning out above. Please see the explanation for more detailed information.
A Map of the Observable Universe
* Image Credit & Copyright: B. Ménard & N. Shtarkman; Data: SDSS, Planck, JHU, Sloan, NASA, ESA
Explanation:
What if you could see out to the edge of the observable universe? You would see galaxies, galaxies, galaxies, and then, well, quasars, which are the bright centers of distant galaxies. To expand understanding of the very largest scales that humanity can see, a map of the galaxies and quasars found by the Sloan Digital Sky Survey from 2000 to 2020 -- out to near the edge of the observable universe -- has been composed. Featured here, one wedge from this survey encompasses about 200,000 galaxies and quasars out beyond a look-back time of 12 billion years and cosmological redshift 5. Almost every dot in the nearby lower part of the illustration represents a galaxy, with redness indicating increasing redshift and distance. Similarly, almost every dot on the upper part represents a distant quasar, with blue-shaded dots being closer than red. Clearly shown among many discoveries, gravity between galaxies has caused the nearby universe to condense and become increasingly more filamentary than the distant universe.
Authors & editors: Robert Nemiroff (MTU) & Jerry Bonnell (UMCP)
NASA Official: Phillip Newman Specific rights apply.
2014 May 12
Illustris Simulation of the Universe
* Video Credit: Illustris Collaboration, NASA, PRACE, XSEDE, MIT, Harvard CfA;
https://physics.mit.edu/faculty/mark-vogelsberger/
https://www.illustris-project.org/people/
https://prace-ri.eu/
https://www.cfa.harvard.edu/
https://www.xsede.org/
https://www.nasa.gov/
* Music: The Poisoned Princess (Media Right Productions)
https://www.mediarightproductions.com/
Explanation:
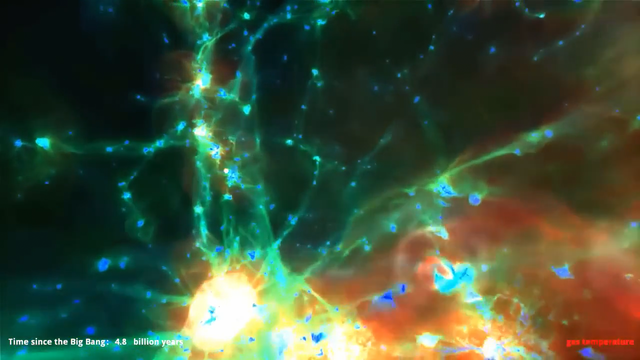
How did we get here? Click play, sit back, and watch. A new computer simulation of the evolution of the universe -- the largest and most sophisticated yet produced -- provides new insight into how galaxies formed and new perspectives into humanity's place in the universe. The Illustris project -- the largest of its type yet -- exhausted 20 million CPU hours following 12 billion resolution elements spanning a cube 35 million light years on a side as it evolved over 13 billion years. The simulation is the first to track matter into the formation of a wide variety of galaxy types. As the virtual universe evolves, some of the matter expanding with the universe soon gravitationally condenses to form filaments, galaxies, and clusters of galaxies. The above video takes the perspective of a virtual camera circling part of this changing universe, first showing the evolution of dark matter, then hydrogen gas coded by temperature (0:45), then heavy elements such as helium and carbon (1:30), and then back to dark matter (2:07). On the lower left the time since the Big Bang is listed, while on the lower right the type of matter being shown is listed. Explosions (0:50) depict galaxy-center supermassive black holes expelling bubbles of hot gas. Interesting discrepancies between Illustris and the real universe do exist and are being studied, including why the simulation produces an overabundance of old stars.
https://apod.nasa.gov/apod/ap140512.html
* i converted and compressed this video to mp4 -crf 28 with ffmpeg
#space #universe #map #astronomy #astrophotography #photography #science #nature #NASA #ESA #education
Alt...
2014 May 12
Illustris Simulation of the Universe
* Video Credit: Illustris Collaboration, NASA, PRACE, XSEDE, MIT, Harvard CfA;
* Music: The Poisoned Princess (Media Right Productions)
Explanation:
How did we get here? Click play, sit back, and watch. A new computer simulation of the evolution of the universe -- the largest and most sophisticated yet produced -- provides new insight into how galaxies formed and new perspectives into humanity's place in the universe. The Illustris project -- the largest of its type yet -- exhausted 20 million CPU hours following 12 billion resolution elements spanning a cube 35 million light years on a side as it evolved over 13 billion years. The simulation is the first to track matter into the formation of a wide variety of galaxy types. As the virtual universe evolves, some of the matter expanding with the universe soon gravitationally condenses to form filaments, galaxies, and clusters of galaxies. The above video takes the perspective of a virtual camera circling part of this changing universe, first showing the evolution of dark matter, then hydrogen gas coded by temperature (0:45), then heavy elements such as helium and carbon (1:30), and then back to dark matter (2:07). On the lower left the time since the Big Bang is listed, while on the lower right the type of matter being shown is listed. ..
Authors & editors: Robert Nemiroff (MTU) & Jerry Bonnell (UMCP)
NASA Official: Phillip Newman Specific rights apply.
Illustris simulation overview poster. Shows the large scale dark matter and gas density fields in projection (top/bottom). The lower three panels show gas temperature, entropy, and velocity at the same scale. Centered on the most massive cluster, for which the circular insets show four predicted observables. The two galaxy insets highlight a central elliptical and a spiral disk satellite (top/bottom).
Credits:
Illustris
www.illustris-project.org
#space #universe #map #astronomy #astrophotography #photography #science #nature #NASA #ESA #education
. The lower three panels show gas temperature, entropy, and velocity at the same scale. Centered on the most massive cluster, for which the circular insets show four predicted observables. The two galaxy insets highlight a central elliptical and a spiral disk satellite (top/bottom).")
Alt...
Illustris simulation overview poster. Shows the large scale dark matter and gas density fields in projection (top/bottom). The lower three panels show gas temperature, entropy, and velocity at the same scale. Centered on the most massive cluster, for which the circular insets show four predicted observables. The two galaxy insets highlight a central elliptical and a spiral disk satellite (top/bottom).
Most detailed simulation of our Universe
The Illustris simulation is the most ambitious computer simulation of our Universe yet performed. The calculation tracks the expansion of the universe, the gravitational pull of matter onto itself, the motion of cosmic gas, as well as the formation of stars and black holes. These physical components and processes are all modeled starting from initial conditions resembling the very young universe 300,000 years after the Big Bang and until the present day, spanning over 13.8 billion years of cosmic evolution. The simulated volume contains tens of thousands of galaxies captured in high-detail, covering a wide range of masses, rates of star formation, shapes, sizes, and with properties that agree well with the galaxy population observed in the real universe. The simulations were run on supercomputers in France, Germany, and the US. The largest was run on 8,192 compute cores, and took 19 million CPU hours. A single state-of-the-art desktop computer would require more than 2000 years to perform this calculation.
Find out more at:
http://www.illustris-project.org
Publication:
"Properties of galaxies reproduced by a hydrodynamic simulation", Vogelsberger, Genel, Springel, Torrey, Sijacki, Xu, Snyder, Bird, Nelson, Hernquist, Nature 509, 177-182 (08 May 2014) doi:10.1038/nature13316
Music:
moonbooter (http://www.moonbooter.de/)
Institutes:
Massachusetts Institute of Technology, Harvard University, Heidelberg Institute for Theoretical Studies, University of Cambridge, Institute for Advanced Study Princeton, Space Telescope Science Institute
-The Illustris Collaboration
https://www.illustris-project.org/
* i converted and compressed this video to mp4 -crf 33 with ffmpeg
#space #universe #map #astronomy #astrophotography #photography #science #nature #NASA #ESA #education

Alt...
The Illustris simulation is the most ambitious computer simulation of our Universe yet performed. The calculation tracks the expansion of the universe, the gravitational pull of matter onto itself, the motion of cosmic gas, as well as the formation of stars and black holes. These physical components and processes are all modeled starting from initial conditions resembling the very young universe 300,000 years after the Big Bang and until the present day, spanning over 13.8 billion years of cosmic evolution. The simulated volume contains tens of thousands of galaxies captured in high-detail, covering a wide range of masses, rates of star formation, shapes, sizes, and with properties that agree well with the galaxy population observed in the real universe. The simulations were run on supercomputers in France, Germany, and the US. The largest was run on 8,192 compute cores, and took 19 million CPU hours. A single state-of-the-art desktop computer would require more than 2000 years to perform this calculation.
Institutes:
Massachusetts Institute of Technology, Harvard University, Heidelberg Institute for Theoretical Studies, University of Cambridge, Institute for Advanced Study Princeton, Space Telescope Science Institute
* i converted and compressed this video to mp4 -crf 33 with ffmpeg
Saturn Moons
more about:
+ Dione
https://science.nasa.gov/saturn/moons/dione/
+ Rhea
https://science.nasa.gov/saturn/moons/rhea/
+ Helene
https://science.nasa.gov/saturn/moons/helene/
+ Atlas
https://science.nasa.gov/saturn/moons/atlas/
Please read the ALT-Texts for short overviews.
#space #saturn #astrophotography #photography #science #astronomy #physics #nature #NASA #ESA #education
 in mean radius orbiting Saturn every 2.7 days at a distance of 234,500 miles (377,400 km), which is roughly the same distance that our Moon orbits Earth.
Dione's density is 1.48 times that of liquid water, suggesting that about a third of Dione is made up of a dense core (probably silicate rock) with the remainder of its material being ice. At Dione's average temperature of -304 degrees Fahrenheit (-186 degrees Celsius or 87 kelvins), ice is very hard and behaves like rock.
Very fine ice powder (equivalent to smoke) from Saturn's E-ring constantly bombards Dione. The dust in the E-ring ultimately comes from Enceladus, which has prominent geyser activity.")
Alt...
Saturn's moon Dione is captured in this view from NASA's Cassini spacecraft, half in shadow and half in light.
NASA/JPL-Caltech/Space Science Institute
Dione
is a small moon of 349 miles (562 km) in mean radius orbiting Saturn every 2.7 days at a distance of 234,500 miles (377,400 km), which is roughly the same distance that our Moon orbits Earth.
Dione's density is 1.48 times that of liquid water, suggesting that about a third of Dione is made up of a dense core (probably silicate rock) with the remainder of its material being ice. At Dione's average temperature of -304 degrees Fahrenheit (-186 degrees Celsius or 87 kelvins), ice is very hard and behaves like rock.
Very fine ice powder (equivalent to smoke) from Saturn's E-ring constantly bombards Dione. The dust in the E-ring ultimately comes from Enceladus, which has prominent geyser activity.
 it is less than a third the radius of Saturn's largest moon, Titan. Rhea is a small, cold, airless body that is very similar to sister moons Dione and Tethys. As with the other two moons, Rhea is tidally locked in phase with its parent — one side always faces toward Saturn — as it completes its 4.5-Earth-day orbit around the planet. Rhea's surface temperatures are also similar to Dione and Tethys, being roughly as warm as -281 degrees Fahrenheit (-174 degrees Celsius) in sunlit areas and ranging down to -364 degrees Fahrenheit (-220 degrees Celsius) in shaded areas. Also like Dione and Tethys, Rhea has a high reflectivity (or geometric albedo) suggesting a surface composition largely of water ice, which behaves like rock in Rhea's temperature range.
Rhea's density of 1.233 times that of liquid water suggests that Rhea is three quarters ice and one quarter rock. Cassini spacecraft measurements from a close encounter showed a moment of inertia about its axis (a measure of how difficult it is to change its rotation) of a higher value than what would be expected if Rhea has a rocky core. Thus, it is thought that Rhea is composed of a homogenous mixture of ice and rock — a frozen dirty snowball at a distance of 327,500 miles (527,000 kilometers)")
Alt...
The Cassini spacecraft looks toward the cratered plains of the trailing hemisphere of Rhea.
NASA/JPL/Space Science Institute
Rhea is the second largest moon of Saturn, but with a mean radius of 475 miles (764 kilometers) it is less than a third the radius of Saturn's largest moon, Titan. Rhea is a small, cold, airless body that is very similar to sister moons Dione and Tethys. As with the other two moons, Rhea is tidally locked in phase with its parent — one side always faces toward Saturn — as it completes its 4.5-Earth-day orbit around the planet. Rhea's surface temperatures are also similar to Dione and Tethys, being roughly as warm as -281 degrees Fahrenheit (-174 degrees Celsius) in sunlit areas and ranging down to -364 degrees Fahrenheit (-220 degrees Celsius) in shaded areas. Also like Dione and Tethys, Rhea has a high reflectivity (or geometric albedo) suggesting a surface composition largely of water ice, which behaves like rock in Rhea's temperature range.
Rhea's density of 1.233 times that of liquid water suggests that Rhea is three quarters ice and one quarter rock. Cassini spacecraft measurements from a close encounter showed a moment of inertia about its axis (a measure of how difficult it is to change its rotation) of a higher value than what would be expected if Rhea has a rocky core. Thus, it is thought that Rhea is composed of a homogenous mixture of ice and rock — a frozen dirty snowball at a distance of 327,500 miles (527,000 kilometers)
 with dimensions 22 x 19 x 18.6 miles (36 x 32 x 30 km). It orbits 234,505 miles (377,400 kilometers) away from Saturn, taking 2.7 Earth days to complete one orbit.")
Alt...
Although travelling at great speed, the Cassini spacecraft managed to capture this close view of Saturn's small moon Helene during a flyby on March 3, 2010.
NASA/JPL/Space Science Institute
Helene, a small and faint moon of Saturn, is referred to as a Trojan moon because it shares its orbit with another moon—Dione, a moon hundreds of times larger than Helene. This complex orbital arrangement is held steady by gravity: Helene is located at a Lagrange point, where it feels the tug of gravity equally from distant Saturn and nearby Dione. For this reason, soon after it was discovered in 1980 it was called Dione B.
This irregularly shaped moon has a mean radius of 10.9 miles (17.6 kilometers) with dimensions 22 x 19 x 18.6 miles (36 x 32 x 30 km). It orbits 234,505 miles (377,400 kilometers) away from Saturn, taking 2.7 Earth days to complete one orbit.
. It orbits 85,544 miles (137,670 km) away from, taking 14.4 hours to complete its trip around the planet.")
Alt...
This montage of views from NASA's Cassini spacecraft shows three of Saturn's small ring moons: Atlas, Daphnis and Pan at the same scale for ease of comparison.
NASA/JPL-Caltech/Space Science Institute
Atlas
is an inner moon of Saturn, orbiting around the outer edge of Saturn's A Ring. Like Pan, Atlas has a distinctive flying saucer shape created by a prominent equatorial ridge not seen on the other small moons of Saturn. Cassini images revealed in 2004 that a temporary faint ring of material with the orbit of Atlas.
The small, pointy moon has a mean radius of 9.4 miles (15.1 km). It orbits 85,544 miles (137,670 km) away from, taking 14.4 hours to complete its trip around the planet.
Saturn Moons
more about:
+ Iapetus
https://science.nasa.gov/saturn/moons/iapetus/
+ Phoebe
https://science.nasa.gov/saturn/moons/phoebe/
+ Tethys
https://science.nasa.gov/saturn/moons/tethys/
+ Telesto
https://science.nasa.gov/saturn/moons/telesto/
Please read the ALT-Texts for short overviews.
#space #saturn #astrophotography #photography #science #astronomy #physics #nature #NASA #ESA #education
 as dark as coal (albedo 0.03-0.05 with a slight reddish tinge) and its trailing hemisphere is much brighter at 0.5-0.6.
Saturn's third largest moon, Iapetus has a mean radius of 457 miles (736 kilometers) and a density only 1.2 times that of liquid water. It has been suggested that Iapetus (like Rhea) is three quarters ice and one quarter rock.
Iapetus orbits at 2,213,000 miles (3,561,000 kilometers) from Saturn. The great distance from Saturn's tidal forces and from most of the other moons and ring particles has probably allowed the Iapetus surface to be largely unaffected by any melting episodes that could have caused some smoothing or \"resurfacing\" as on some of the moons closer to Saturn.
However, despite the great distance, Saturn has tidally locked Iapetus. The moon always presents the same face toward Saturn. With its distant, inclined orbit, Iapetus is the only large moon from which there is a nice view of the rings of Saturn.
As with some other Saturnian moons, Iapetus is in resonance with Saturn's largest moon, Titan, which orbits at 759,200 miles (1,221,850 kilometers)")
Alt...
These two global images of Iapetus show the extreme brightness dichotomy on the surface of this peculiar Saturnian moon. The left-hand panel shows the moon's leading hemisphere and the right-hand panel shows the moon's trailing side.
NASA/JPL-Caltech/Space Science Institute
Iapetus
has been called the yin and yang of the Saturn moons because its leading hemisphere has a reflectivity (or albedo) as dark as coal (albedo 0.03-0.05 with a slight reddish tinge) and its trailing hemisphere is much brighter at 0.5-0.6.
Saturn's third largest moon, Iapetus has a mean radius of 457 miles (736 kilometers) and a density only 1.2 times that of liquid water. It has been suggested that Iapetus (like Rhea) is three quarters ice and one quarter rock.
Iapetus orbits at 2,213,000 miles (3,561,000 kilometers) from Saturn. The great distance from Saturn's tidal forces and from most of the other moons and ring particles has probably allowed the Iapetus surface to be largely unaffected by any melting episodes that could have caused some smoothing or "resurfacing" as on some of the moons closer to Saturn.
However, despite the great distance, Saturn has tidally locked Iapetus. The moon always presents the same face toward Saturn. With its distant, inclined orbit, Iapetus is the only large moon from which there is a nice view of the rings of Saturn.
As with some other Saturnian moons, Iapetus is in resonance with Saturn's largest moon, Titan, which orbits at 759,200 miles (1,221,850 kilometers)
 from the planet, almost four times the distance from Saturn than its nearest neighbor, the moon Iapetus. Phoebe and Iapetus are the only major moons in the Saturnian system that do not orbit closely to the plane of Saturn's equator.
Phoebe is roughly spherical and has a mean radius of about 66.2 miles (106.5 kilometers), about one-sixteenth the radius of Earth's Moon. Phoebe rotates on its axis every nine hours, and it completes a full orbit around Saturn in about 18 Earth months. Its irregular, elliptical orbit is inclined about 175 degrees to Saturn's equator. Phoebe's orbit is also retrograde, which means it goes around Saturn in the opposite direction than most other moons — as well as most objects in the solar system.
Unlike most major moons orbiting Saturn, Phoebe is very dark and reflects only 6 percent of the sunlight it receives. Its darkness and irregular, retrograde orbit suggest Phoebe is most likely a captured object. A captured object is a celestial body that is trapped by the gravitational pull of a much bigger body, generally a planet. Phoebe's darkness, in particular, suggests that the small moon comes from the outer solar system, an area where there is plenty of dark material.")
Alt...
Phoebe's true nature is revealed in startling clarity in this mosaic of two images taken during Cassini's flyby on June 11, 2004.
NASA/JPL
Phoebe
is one of Saturn's most intriguing moons, orbiting at a distance of 8,049,668 miles (12,952,000 kilometers) from the planet, almost four times the distance from Saturn than its nearest neighbor, the moon Iapetus. Phoebe and Iapetus are the only major moons in the Saturnian system that do not orbit closely to the plane of Saturn's equator.
Phoebe is roughly spherical and has a mean radius of about 66.2 miles (106.5 kilometers), about one-sixteenth the radius of Earth's Moon. Phoebe rotates on its axis every nine hours, and it completes a full orbit around Saturn in about 18 Earth months. Its irregular, elliptical orbit is inclined about 175 degrees to Saturn's equator. Phoebe's orbit is also retrograde, which means it goes around Saturn in the opposite direction than most other moons — as well as most objects in the solar system.
Unlike most major moons orbiting Saturn, Phoebe is very dark and reflects only 6 percent of the sunlight it receives. Its darkness and irregular, retrograde orbit suggest Phoebe is most likely a captured object. A captured object is a celestial body that is trapped by the gravitational pull of a much bigger body, generally a planet. Phoebe's darkness, in particular, suggests that the small moon comes from the outer solar system, an area where there is plenty of dark material.
 in mean radius, with dimensions 669 x 657 x 654 miles (1076.8 x 1057.4 x 1052.6 kilometers). This cold, airless and heavily scarred body is very similar to sister moons DionThe Voyager images showed a major impact crater and a great chasm. The Cassini spacecraft has added details including a great variety of colors at small scales suggesting a variety of materials not seen elsewhere.e and Rhea except that Tethys is not as heavily cratered as the other two. This may be because its proximity to Saturn causes more tidal warming, and that warming kept Tethys partially molten longer, erasing or dulling more of the early terrain.
Tethys' density is 0.97 times that of liquid water, which suggests that Tethys is composed almost entirely of water ice plus a small amount of rock.
Tethys has a high reflectivity (or visual albedo) of 1.229 in the visual range, again suggesting a composition largely of water ice, which would behave like rock in the Tethyan average temperature of -305 degrees Fahrenheit (-187 degrees Celsius). Many of the crater floors on Tethys are bright, which also suggests an abundance of water ice. Also contributing to the high reflectivity is that Tethys is bombarded by Saturn E-ring water-ice particles generated by geysers on Enceladus")
Alt...
The vast expanse of the crater Odysseus spreads out below Cassini in this mosaic view of Saturn's moon Tethys.
NASA/JPL/Space Science Institute
Tethys
is Saturn's fifth largest moon. Its irregular shape is 331 miles (533 kilometers) in mean radius, with dimensions 669 x 657 x 654 miles (1076.8 x 1057.4 x 1052.6 kilometers). This cold, airless and heavily scarred body is very similar to sister moons DionThe Voyager images showed a major impact crater and a great chasm. The Cassini spacecraft has added details including a great variety of colors at small scales suggesting a variety of materials not seen elsewhere.e and Rhea except that Tethys is not as heavily cratered as the other two. This may be because its proximity to Saturn causes more tidal warming, and that warming kept Tethys partially molten longer, erasing or dulling more of the early terrain.
Tethys' density is 0.97 times that of liquid water, which suggests that Tethys is composed almost entirely of water ice plus a small amount of rock.
Tethys has a high reflectivity (or visual albedo) of 1.229 in the visual range, again suggesting a composition largely of water ice, which would behave like rock in the Tethyan average temperature of -305 degrees Fahrenheit (-187 degrees Celsius). Many of the crater floors on Tethys are bright, which also suggests an abundance of water ice. Also contributing to the high reflectivity is that Tethys is bombarded by Saturn E-ring water-ice particles generated by geysers on Enceladus
 from Saturn, the moon takes 45.3 hours to make one trip around the planet. Telesto orbits about 60 degrees ahead of Tethys, while Calypso orbits behind Tethys by about 60 degrees. Because Telesto is in the front of this three-moon group, it is called the \"leading Trojan.\"
Telesto is 7.7 miles (12.4 kilometers) in mean radius and appears to have a smooth, icy surface. It does not show the signs of intense cratering seen on many of Saturn's other moons.")
Alt...
The Cassini spacecraft passed within a cosmic stone's throw of Telesto in October, 2005 capturing this shot of the tiny Trojan moon.
NASA/JPL/Space Science Institute
Telesto
is known as a "Tethys Trojan" because, together with Calypso, it circles Saturn in the same orbit as the moon Tethys. At a distance of about 183,000 miles (295,000 kilometers) from Saturn, the moon takes 45.3 hours to make one trip around the planet. Telesto orbits about 60 degrees ahead of Tethys, while Calypso orbits behind Tethys by about 60 degrees. Because Telesto is in the front of this three-moon group, it is called the "leading Trojan."
Telesto is 7.7 miles (12.4 kilometers) in mean radius and appears to have a smooth, icy surface. It does not show the signs of intense cratering seen on many of Saturn's other moons.
Saturn Moons
more about:
+ Pandora
https://science.nasa.gov/saturn/moons/pandora/
+ Janus
https://science.nasa.gov/saturn/moons/janus/
+ Epimetheus
https://science.nasa.gov/saturn/moons/epimetheus/
+ Mimas
https://science.nasa.gov/saturn/moons/mimas/
Please read the ALT-Texts for short overviews.
#space #saturn #astrophotography #photography #science #astronomy #physics #nature #NASA #ESA #education
 icy material. Even the craters on Pandora are coated in debris, a stark contrast to the crisply-defined craters of other moons, such as Hyperion. Curious grooves and ridges also appear to cross the surface of the small moon.
Pandora is interesting because it tends to disrupt the F ring, while Prometheus helps to keep the primary ring in place.
Pandora is about 25.3 miles (40.7 kilometers) in mean radius. It orbits 88,000 miles (142,000 kilometers) away from Saturn, near the F ring, taking 15.1 hours to go around Saturn.")
Alt...
Cassini's best close-up view of Saturn's F ring shepherd moon, Pandora, shows that this small ring-moon is coated in fine dust-sized icy material.
NASA/JPL
Pandora,
a potato-shaped moon, is coated in a fine (dust-sized) icy material. Even the craters on Pandora are coated in debris, a stark contrast to the crisply-defined craters of other moons, such as Hyperion. Curious grooves and ridges also appear to cross the surface of the small moon.
Pandora is interesting because it tends to disrupt the F ring, while Prometheus helps to keep the primary ring in place.
Pandora is about 25.3 miles (40.7 kilometers) in mean radius. It orbits 88,000 miles (142,000 kilometers) away from Saturn, near the F ring, taking 15.1 hours to go around Saturn.
 and dimensions of 122 x 119 x 93 miles (196 x 192 x 150 kilometers, respectively).
Janus is extensively cratered with several craters larger than 19 miles (30 kilometers). Janus' prominent craters are named Castor, Phoebe, Idas and Lynceus.
This oblong moon orbits 94,000 miles (151,000 kilometers) away from Saturn, taking 17 hours to complete one orbit, in the gap between the F and G rings, but it doesn't do this alone. It actually shares its orbit with a sister moon named Epimetheus, in what is called a co-orbital condition or 1:1 resonance.
One moon orbits 31 miles (50 km) farther away from the planet than the other, taking more time to complete one turn around Saturn. This slight difference means the inner, faster moving moon starts to catch up to the other approximately every four Earth years. Interestingly, when this happens, the gravity interaction between the moons causes them to trade places between these inner and outer orbits. The closest they get is about 6,200 miles (15,000 km). This is the only such orbital configuration known in the solar system.")
Alt...
Shadows darken parts of some of Janus' large craters as Cassini takes a close look during its flyby of this Saturnian moon on March 27, 2012.
NASA/JPL-Caltech/Space Science Institute
Janus
is a potato-shaped moon with a mean radius of 55.6 miles (89.5 kilometers) and dimensions of 122 x 119 x 93 miles (196 x 192 x 150 kilometers, respectively).
Janus is extensively cratered with several craters larger than 19 miles (30 kilometers). Janus' prominent craters are named Castor, Phoebe, Idas and Lynceus.
This oblong moon orbits 94,000 miles (151,000 kilometers) away from Saturn, taking 17 hours to complete one orbit, in the gap between the F and G rings, but it doesn't do this alone. It actually shares its orbit with a sister moon named Epimetheus, in what is called a co-orbital condition or 1:1 resonance.
One moon orbits 31 miles (50 km) farther away from the planet than the other, taking more time to complete one turn around Saturn. This slight difference means the inner, faster moving moon starts to catch up to the other approximately every four Earth years. Interestingly, when this happens, the gravity interaction between the moons causes them to trade places between these inner and outer orbits. The closest they get is about 6,200 miles (15,000 km). This is the only such orbital configuration known in the solar system.
![NASA's Cassini spacecraft captured this view of Saturn's moon Epimetheus (116 kilometers, or 72 miles across) during a moderately close flyby on Dec. 6, 2015.
NASA/JPL-Caltech/Space Science Institute
Epimetheus
is a potato-shaped moon with a mean radius of 36 miles (58 km) and dimensions of 84 x 65 x 65 miles (135 x 108 x 105 km, respectively). Its shape reflects pronounced flattening at the Epimethean South Pole associated with the remains of a large crater. Epimetheus has several craters larger than 19 miles (30 km), including Hilairea and Pollux.
This oblong moon orbits 94,000 miles (151,000 km) away from Saturn, taking 17 hours to circle the planet, in the gap between the F and G rings, but it doesn't do this alone. It actually shares its orbit with a sister moon named Janus, in what is called a co-orbital condition or 1:1 resonance.
[...]
Epimetheus and Janus
may have formed by the break-up of one moon. If so, it would have happened early in the life of the Saturn system since both moons have ancient cratered surfaces, many with soft edges because of dust. They also have some grooves (similar to grooves on the Martian moon Phobos) suggesting some glancing blows from other bodies. Together, the moons trail enough particles to generate a faint ring. However, except for very powerful telescopes, the region of their common orbit appears as a gap between Saturn's prominent F and G rings.](https://files.defcon.social/dcsocial-s3/media_attachments/files/115/593/118/324/033/823/original/851a53b00ec3e84e.jpg "NASA's Cassini spacecraft captured this view of Saturn's moon Epimetheus (116 kilometers, or 72 miles across) during a moderately close flyby on Dec. 6, 2015.
NASA/JPL-Caltech/Space Science Institute
Epimetheus
is a potato-shaped moon with a mean radius of 36 miles (58 km) and dimensions of 84 x 65 x 65 miles (135 x 108 x 105 km, respectively). Its shape reflects pronounced flattening at the Epimethean South Pole associated with the remains of a large crater. Epimetheus has several craters larger than 19 miles (30 km), including Hilairea and Pollux.
This oblong moon orbits 94,000 miles (151,000 km) away from Saturn, taking 17 hours to circle the planet, in the gap between the F and G rings, but it doesn't do this alone. It actually shares its orbit with a sister moon named Janus, in what is called a co-orbital condition or 1:1 resonance.
[...]
Epimetheus and Janus
may have formed by the break-up of one moon. If so, it would have happened early in the life of the Saturn system since both moons have ancient cratered surfaces, many with soft edges because of dust. They also have some grooves (similar to grooves on the Martian moon Phobos) suggesting some glancing blows from other bodies. Together, the moons trail enough particles to generate a faint ring. However, except for very powerful telescopes, the region of their common orbit appears as a gap between Saturn's prominent F and G rings.")
Alt...
NASA's Cassini spacecraft captured this view of Saturn's moon Epimetheus (116 kilometers, or 72 miles across) during a moderately close flyby on Dec. 6, 2015.
NASA/JPL-Caltech/Space Science Institute
Epimetheus
is a potato-shaped moon with a mean radius of 36 miles (58 km) and dimensions of 84 x 65 x 65 miles (135 x 108 x 105 km, respectively). Its shape reflects pronounced flattening at the Epimethean South Pole associated with the remains of a large crater. Epimetheus has several craters larger than 19 miles (30 km), including Hilairea and Pollux.
This oblong moon orbits 94,000 miles (151,000 km) away from Saturn, taking 17 hours to circle the planet, in the gap between the F and G rings, but it doesn't do this alone. It actually shares its orbit with a sister moon named Janus, in what is called a co-orbital condition or 1:1 resonance.
[...]
Epimetheus and Janus
may have formed by the break-up of one moon. If so, it would have happened early in the life of the Saturn system since both moons have ancient cratered surfaces, many with soft edges because of dust. They also have some grooves (similar to grooves on the Martian moon Phobos) suggesting some glancing blows from other bodies. Together, the moons trail enough particles to generate a faint ring. However, except for very powerful telescopes, the region of their common orbit appears as a gap between Saturn's prominent F and G rings.
. It is not quite big enough to hold a round shape, so it is somewhat ovoid with dimensions of 129 x 122 x 119 miles (207 x 197 x 191 kilometers, respectively). Its low density suggests that it consists almost entirely of water ice, which is the only substance ever detected on Mimas.
At a mean distance just over 115,000 miles (186,000 kilometers) from the massive planet, Mimas takes only 22 hours and 36 minutes to complete an orbit. Mimas is tidally locked: it keeps the same face toward Saturn as it flies around the planet, just as our Moon does with Earth.
Most of the Mimas surface is saturated with impact craters ranging in size up to greater than 25 miles (40 kilometers) in diameter. However, the craters in the South Pole region of Mimas are generally 12.4 miles (20 kilometers) in diameter or less. This suggests that some melting or other resurfacing processes occurred there later than on the rest of the moon. (Interestingly, the South Pole area of Enceladus appears to be the source of that moon's geysers.)
Its most distinguishing feature is a giant impact crater – named Herschel after the moon's discoverer ...")
Alt...
NASA's Cassini spacecraft spotted Saturn's moon Mimas and its large Herschel Crater. The crater looks somewhat like an eye peering out into space.
NASA/JPL/Space Science Institute
Crater-covered Mimas is the smallest and innermost of Saturn's major moons. It has a mean diameter of about 245 miles (394 kilometers). It is not quite big enough to hold a round shape, so it is somewhat ovoid with dimensions of 129 x 122 x 119 miles (207 x 197 x 191 kilometers, respectively). Its low density suggests that it consists almost entirely of water ice, which is the only substance ever detected on Mimas.
At a mean distance just over 115,000 miles (186,000 kilometers) from the massive planet, Mimas takes only 22 hours and 36 minutes to complete an orbit. Mimas is tidally locked: it keeps the same face toward Saturn as it flies around the planet, just as our Moon does with Earth.
Most of the Mimas surface is saturated with impact craters ranging in size up to greater than 25 miles (40 kilometers) in diameter. However, the craters in the South Pole region of Mimas are generally 12.4 miles (20 kilometers) in diameter or less. This suggests that some melting or other resurfacing processes occurred there later than on the rest of the moon. (Interestingly, the South Pole area of Enceladus appears to be the source of that moon's geysers.)
Its most distinguishing feature is a giant impact crater – named Herschel after the moon's discoverer ...
Saturn Moons
The Saturn system teems with natural satellites, from planet-sized Titan to small oddballs, shaped like potatoes or ravioli.
more about:
+ Titan
https://science.nasa.gov/saturn/moons/titan/facts/
+ Enceladus
https://science.nasa.gov/saturn/moons/enceladus/
+ Hyperion
https://science.nasa.gov/saturn/moons/enceladus/
+ Prometheus
https://science.nasa.gov/saturn/moons/prometheus/
Please read the ALT-Texts for short overviews.
#space #saturn #astrophotography #photography #science #astronomy #physics #nature #NASA #ESA #education
, and is nearly 50 percent wider than Earth’s moon. Titan is about 759,000 miles (1.2 million kilometers) from Saturn, which itself is about 886 million miles (1.4 billion kilometers) from the Sun, or about 9.5 astronomical units (AU). One AU is the distance from Earth to the Sun. Light from the Sun takes about 80 minutes to reach Titan; because of the distance, sunlight is about 100 times fainter at Saturn and Titan than at Earth.")
Alt...
Titan passes in front of Saturn in this image from NASA's Cassini spacecraft.
NASA/JPL-Caltech/Space Science Institute
Titan
has a radius of about 1,600 miles (2,575 kilometers), and is nearly 50 percent wider than Earth’s moon. Titan is about 759,000 miles (1.2 million kilometers) from Saturn, which itself is about 886 million miles (1.4 billion kilometers) from the Sun, or about 9.5 astronomical units (AU). One AU is the distance from Earth to the Sun. Light from the Sun takes about 80 minutes to reach Titan; because of the distance, sunlight is about 100 times fainter at Saturn and Titan than at Earth.
 of the surface of Enceladus.
NASA/JPL/Space Science Institute
Enceladus
orbits Saturn at a distance of 148,000 miles (238,000 kilometers) between the orbits of two other moons, Mimas and Tethys. Enceladus is tidally locked with Saturn, keeping the same face toward the planet. It completes one orbit every 32.9 hours within the densest part of Saturn's E Ring. Also, like some other moons in the extensive systems of the giant planets, Enceladus is trapped in what’s called an orbital resonance, which is when two or more moons line up with their parent planet at regular intervals and interact gravitationally. Enceladus orbits Saturn twice every time Dione, a larger moon, orbits once. Dione’s gravity stretches Enceladus’ orbit into an elliptical shape, so Enceladus is sometimes closer and other times farther from Saturn, causing tidal heating within the moon.
Parts of Enceladus show craters up to 22 miles (35 kilometers) in diameter, while other regions have few craters, indicating major resurfacing events in the geologically recent past. In particular, the south polar region of Enceladus is almost entirely free of impact craters. The area is also littered with house-sized ice boulders and regions carved by tectonic patterns unique to this region of the moon.")
Alt...
This mosaic of Saturn's moon Enceladus was created with images captured by NASA's Cassini spacecraft on Oct. 9, 2008, after the spacecraft came within about 16 miles (25 kilometers) of the surface of Enceladus.
NASA/JPL/Space Science Institute
Enceladus
orbits Saturn at a distance of 148,000 miles (238,000 kilometers) between the orbits of two other moons, Mimas and Tethys. Enceladus is tidally locked with Saturn, keeping the same face toward the planet. It completes one orbit every 32.9 hours within the densest part of Saturn's E Ring. Also, like some other moons in the extensive systems of the giant planets, Enceladus is trapped in what’s called an orbital resonance, which is when two or more moons line up with their parent planet at regular intervals and interact gravitationally. Enceladus orbits Saturn twice every time Dione, a larger moon, orbits once. Dione’s gravity stretches Enceladus’ orbit into an elliptical shape, so Enceladus is sometimes closer and other times farther from Saturn, causing tidal heating within the moon.
Parts of Enceladus show craters up to 22 miles (35 kilometers) in diameter, while other regions have few craters, indicating major resurfacing events in the geologically recent past. In particular, the south polar region of Enceladus is almost entirely free of impact craters. The area is also littered with house-sized ice boulders and regions carved by tectonic patterns unique to this region of the moon.
 from Saturn in an eccentric orbit. This contributes to variations in the spin or rotation of Hyperion. A stronger effect on Hyperion's rotation is that it is in resonance with Saturn's largest moon, Titan, which orbits at 759,200 miles (1,221,850 kilometers). Thus, the two objects speed up and slow down as they pass each other in a complex set of variations. Because Hyperion is much smaller than Titan, its rotation and orbit are affected vastly more than the larger moon, and Titan apparently keeps the Hyperion orbit eccentric rather than growing more circular over time.
The great distance from Saturn and resonance with Titan has also kept Hyperion from becoming tidally locked facing Saturn. Hyperion rotates roughly every 13 days during its 21-day orbit.")
Alt...
This stunning false-color view of Saturn's moon Hyperion reveals crisp details across the strange, tumbling moon's surface. Differences in color could represent differences in the composition of surface materials. The view was obtained during Cassini's close flyby on Sept. 26, 2005.
NASA/JPL-Caltech/Space Science Institute
Hyperion
rotates chaotically, tumbling unpredictably through space as it orbits Saturn. Hyperion orbits at a mean distance of 933,000 miles (1,500,000 kilometers) from Saturn in an eccentric orbit. This contributes to variations in the spin or rotation of Hyperion. A stronger effect on Hyperion's rotation is that it is in resonance with Saturn's largest moon, Titan, which orbits at 759,200 miles (1,221,850 kilometers). Thus, the two objects speed up and slow down as they pass each other in a complex set of variations. Because Hyperion is much smaller than Titan, its rotation and orbit are affected vastly more than the larger moon, and Titan apparently keeps the Hyperion orbit eccentric rather than growing more circular over time.
The great distance from Saturn and resonance with Titan has also kept Hyperion from becoming tidally locked facing Saturn. Hyperion rotates roughly every 13 days during its 21-day orbit.
 during a moderately close flyby on Dec. 6, 2015.
NASA/JPL-Caltech/Space Science Institute
Prometheus
acts as a shepherding moon, constraining the extent of the inner edge of Saturn's F Ring. Prometheus is extremely irregular and has visible craters — some up to 12.4 miles (20 kilometers) in diameter. However, it is much less cratered than its nearby neighbors Pandora, Janus and Epimetheus. The density of Prometheus has been estimated to be low; it is probably a porous, icy body.
The potato-shaped moon is about 26.8 miles (43.1 kilometers) in mean radius, orbiting Saturn at a distance of 87,000 miles (139,000 kilometers), taking 14.7 hours to go around the planet.")
Alt...
NASA's Cassini spacecraft spied details on the pockmarked surface of Saturn's moon Prometheus (86 kilometers, or 53 miles across) during a moderately close flyby on Dec. 6, 2015.
NASA/JPL-Caltech/Space Science Institute
Prometheus
acts as a shepherding moon, constraining the extent of the inner edge of Saturn's F Ring. Prometheus is extremely irregular and has visible craters — some up to 12.4 miles (20 kilometers) in diameter. However, it is much less cratered than its nearby neighbors Pandora, Janus and Epimetheus. The density of Prometheus has been estimated to be low; it is probably a porous, icy body.
The potato-shaped moon is about 26.8 miles (43.1 kilometers) in mean radius, orbiting Saturn at a distance of 87,000 miles (139,000 kilometers), taking 14.7 hours to go around the planet.
Saturn
+ has 63 confirmed and named moons.
+ Only seven moons of the planet Saturn are visible.
+ Two of Saturn’s moons hold a certain potential for life in subsurface habitats.
A moon is essentially an astronomical body that describes an orbit around a planet, a dwarf planet, or an asteroid.
Earth has only one moon, but other planets have two or more moons or none at all. In the Solar System, Mercury and Venus do not have any moons, Mars has two small, close-orbiting moons called Phobos and Deimos, and Jupiter has as many as 80 moons.
In the case of Saturn, it has 63 confirmed and named moons, and another 20 are awaiting confirmation of discovery and official naming by the International Astronomical Union (IAU).
from
Maia Mulko
interestingengineering.com
https://interestingengineering.com/culture/facts-about-saturn-moons
#space #saturn #astrophotography #photography #science #astronomy #physics #nature #NASA #ESA #education
, Titan can be spotted even in urban skies with a 60-millimeter (2-inch) telescope.")
Alt...
Major moons of Saturn.
How many Saturn moons are visible?
Only seven moons of the planet Saturn are visible. Titan is the easiest to see because it is the biggest and brightest.
With a diameter of 3,199.7 miles (about 5,150 kilometers), Titan can be spotted even in urban skies with a 60-millimeter (2-inch) telescope.
SubTopic> Moons of Saturn
Group Portrait
On July 29, 2011, Cassini captured five of Saturn's moons in a single frame with its narrow-angle camera. This is a full-color look at a view that was originally published in September 2011 (see PIA14573).
Moons visible in this view: Janus (111 miles, or 179 kilometers across) is on the far left; Pandora (50 miles, or 81 kilometers across) orbits just beyond the thin F ring near the center of the image; brightly reflective Enceladus (313 miles, or 504 kilometers across) appears above center; Saturn's second largest moon, Rhea (949 miles, or 1,528 kilometers across), is bisected by the right edge of the image; and the smaller moon Mimas (246 miles, or 396 kilometers across) is seen just to the left of Rhea.
This view looks toward the northern, sunlit side of the rings from just above the ringplane. Rhea is closest to Cassini here. The rings are beyond Rhea and Mimas. Enceladus is beyond the rings. The view was acquired at a distance of approximately 684,000 miles (1.1 million kilometers) from Rhea and 1.1 million miles (1.8 million kilometers) from Enceladus.
PIA12797
Credits: NASA/JPL-Caltech/Space Science Institute
#space #saturn #astrophotography #photography #science #astronomy #physics #nature #NASA #ESA #education
:
Cassini
Huygens
Spacecraft(s):
Cassini Orbiter
Instrument(s):
Imaging Science Subsystem - Narrow Angle")
Alt...
Image Addition Date:
07/30/2018
Target:
Saturn
Is a satellite of:
Sun
Mission(s):
Cassini
Huygens
Spacecraft(s):
Cassini Orbiter
Instrument(s):
Imaging Science Subsystem - Narrow Angle
Saturn's Rings
- NASA Science, Alicia Cermak
This is an artist's concept of Saturn's rings and major icy moons.
Saturn's rings make up an enormous, complex structure. From edge-to-edge, the ring system would not even fit in the distance between Earth and the Moon. The seven main rings are labeled in the order in which they were discovered. From the planet outward, they are D, C, B, A, F, G and E.
The D ring is very faint and closest to Saturn. The main rings are A, B and C. The outermost ring, easily seen with Earth-based telescopes, is the A ring. The Cassini Division is the largest gap in the rings and separates the B ring from the A ring. Just outside the A ring is the narrow F ring, shepherded by tiny moons, Pandora and Prometheus. Beyond that are two much fainter rings named G and E. Saturn's diffuse E ring is the largest planetary ring in our solar system, extending from Mimas' orbit to Titan's orbit, about 1 million kilometers (621,370 miles).
The particles in Saturn's rings are composed primarily of water ice and range in size from microns to tens of meters. The rings show a tremendous amount of structure on all scales; some of this structure is related to gravitational interactions with Saturn's many moons, but much of it remains unexplained. One moonlet, Pan, actually orbits inside the A ring in a 330-kilometer-wide (200-mile) gap called the Encke Gap. The main rings (A, B and C) are less than 100 meters (300 feet) thick in most places, compared to their radial extent of 62,120 kilometers (38,600 miles). The main rings are much younger than the age of the solar system, perhaps only a few hundred million years old. They may have formed from the breakup of one of Saturn's moons or from a comet or meteor that was torn apart by Saturn's gravity.
Credit: NASA/JPL
https://science.nasa.gov/resource/saturns-rings-2/
#space #saturn #astrophotography #photography #science #astronomy #physics #nature #NASA #ESA #education

Alt...
This is an artist's concept of Saturn's rings and major icy moons.
Saturn's rings make up an enormous, complex structure. From edge-to-edge, the ring system would not even fit in the distance between Earth and the Moon. The seven main rings are labeled in the order in which they were discovered. From the planet outward, they are D, C, B, A, F, G and E.
Credit: NASA/JPL
SubTopic> Moons of Saturn
The Saturn system
teems with natural satellites, from planet-sized Titan to small oddballs, shaped like potatoes or ravioli.
Saturn has 274 confirmed moons in its orbit, far more than any other planet in our solar system. In March 2025, astronomers confirmed the discovery of 128 small moons around Saturn — adding to the already large moon count.
Saturn's moons range in size from larger than the planet Mercury – the giant moon Titan – to as small as a sports arena. The small moon Enceladus has a global ocean under a thick, icy shell. Scientists have identified both moons as high-priority science destinations for future deep space missions.
Surrounded by more than 60 known moons, Saturn is home to some of the most fascinating landscapes in our solar system. From the jets of water that spray from Enceladus to the methane lakes on smoggy Titan, the Saturn system is a rich source of scientific discovery and still holds many mysteries. The farthest planet from Earth discovered by the unaided human eye, Saturn has been known since ancient times. The planet is named for the Roman god of agriculture and wealth, who was also the father of Jupiter.
The following Link will take you to an interactive 3D api to explore the moon-system of Saturn:
https://eyes.nasa.gov/apps/solar-system/#/saturn/moons?embed=true
#space #saturn #astrophotography #photography #science #astronomy #physics #nature #NASA #ESA #education #apod

Alt...
Surrounded by more than 60 known moons, Saturn is home to some of the most fascinating landscapes in our solar system. From the jets of water that spray from Enceladus to the methane lakes on smoggy Titan, the Saturn system is a rich source of scientific discovery and still holds many mysteries. The farthest planet from Earth discovered by the unaided human eye, Saturn has been known since ancient times. The planet is named for the Roman god of agriculture and wealth, who was also the father of Jupiter.
The provided Link will take you to an interactive 3D api to explore the moon-system of Saturn
annotataed version of previews image
Dione and Rhea Ring Transit
* Image Credit & Copyright: Christopher Go
#space #saturn #astrophotography #photography #science #astronomy #physics #nature #NASA #ESA #education #apod

Alt...
annotataed version of previews image
Dione and Rhea Ring Transit
* Image Credit & Copyright: Christopher Go
2025 November 22
Dione and Rhea Ring Transit
* Image Credit & Copyright: Christopher Go
https://astro.christone.net/
Explanation:
Seen to the left of Saturn's banded planetary disk, small icy moons Dione and Rhea are caught passing in front of the gas giant's extensive ring system in this sharp telescopic snapshot. The remarkable image was recorded on November 20, when Saturn's rings were nearly edge-on when viewed from planet Earth. In fact, every 13 to 16 years the view from planet Earth aligns with Saturn's ring plane to produce a series of ring plane crossings. During a ring plane crossing, the interplanetary edge-on perspective makes the thin but otherwise bright rings seem to disappear. By November 23rd Saturn's rings will have reached a minimum angle for now, at their narrowest for viewing from planet Earth, but then start to widen again. Of course, Dione and Rhea orbit Saturn near the ring plane once every 2.7 and 4.5 days respectively, while the next series of Saturn ring plane crossings as seen from Earth will begin again in 2038.
https://science.nasa.gov/saturn/moons/dione/
https://science.nasa.gov/saturn/moons/rhea/
https://science.nasa.gov/resource/saturns-rings-2/
https://astro.christone.net/saturn/index.htm
https://science.nasa.gov/missions/hubble/hubble-views-saturn-ring-plane-crossing/
https://apod.nasa.gov/apod/fap/ap251116.html
https://science.nasa.gov/solar-system/whats-up-november-2025-skywatching-tips-from-nasa/
https://gizmodo.com/saturn-will-look-naked-in-the-night-sky-this-weekend-2000689525
https://science.nasa.gov/saturn/moons/
https://astro.christone.net/saturn/index.htm
https://apod.nasa.gov/apod/ap251122.html
#space #saturn #astrophotography #photography #science #astronomy #physics #nature #NASA #ESA #education #apod
 & Jerry Bonnell (UMCP)
NASA Official: Amber Straughn Specific rights apply.
NASA Web Privacy, Accessibility, Notices;
A service of: ASD at NASA / GSFC,
NASA Science Activation
& Michigan Tech. U.")
Alt...
2025 November 22
Dione and Rhea Ring Transit
* Image Credit & Copyright: Christopher Go
Explanation:
Seen to the left of Saturn's banded planetary disk, small icy moons Dione and Rhea are caught passing in front of the gas giant's extensive ring system in this sharp telescopic snapshot. The remarkable image was recorded on November 20, when Saturn's rings were nearly edge-on when viewed from planet Earth. In fact, every 13 to 16 years the view from planet Earth aligns with Saturn's ring plane to produce a series of ring plane crossings. During a ring plane crossing, the interplanetary edge-on perspective makes the thin but otherwise bright rings seem to disappear. By November 23rd Saturn's rings will have reached a minimum angle for now, at their narrowest for viewing from planet Earth, but then start to widen again. Of course, Dione and Rhea orbit Saturn near the ring plane once every 2.7 and 4.5 days respectively, while the next series of Saturn ring plane crossings as seen from Earth will begin again in 2038.
Authors & editors: Robert Nemiroff (MTU) & Jerry Bonnell (UMCP)
NASA Official: Amber Straughn Specific rights apply.
NASA Web Privacy, Accessibility, Notices;
A service of: ASD at NASA / GSFC,
NASA Science Activation
& Michigan Tech. U.
![[?]](https://static.partyon.xyz/accounts/avatars/109/444/593/327/617/077/original/7ce9a1f4687784cb.jpg)
What's that sound?
High school students in the South are taking more collective action against ICE than the grown ass adults, politicians and cops?
Very interesting.
#ICE #fuckice #ChingaLaMigra #NC #northcarolina #Charlotte #Mecklenburg #Raleigh #school #education
![[?]](https://s3.eu-central-2.wasabisys.com/mastodonworld/accounts/avatars/109/362/359/610/912/307/original/4854f87af56f0d9a.png)
"The town is rough, even by rez standards. 'There’s buildings that have been standing just in a void. No humans, no life running through these buildings for years,' Hall explained. 'But there’s immense beauty here, too — extreme beauty.'" @Toastie for High Country News
https://www.hcn.org/issues/57-11/heavy-metal-is-healing-teens-on-the-blackfeet-nation/
2025 November 17
Comet Lemmon's Wandering Tail
* Image Credit: Ignacio Fernández
https://www.instagram.com/igneis.nightscapes/
Explanation:
What has happened to Comet Lemmon's tail? The answer is blowing in the wind — the wind from the Sun in this case. This continuous outflow of charged particles from the Sun has been quite variable of late, as the Sun emits bursts of energy, CMEs, that push out and deflect charged particles emitted by the comet itself. The result is a blue hued ion tail for Comet C/2025 A6 (Lemmon) that is not only impressively intricate but takes some unusual turns. This long-duration composite image taken from Alfacar, Spain last month captured this inner Solar System ionic tumult. Comet Lemmon is now fading as it heads out away from the Earth and Sun and back into the outer Solar System.
https://en.wikipedia.org/wiki/C/2025_A6_(Lemmon)
https://apod.nasa.gov/apod/ap220125.html
https://theskylive.com/c2025a6-info
https://science.nasa.gov/sun/what-is-the-solar-wind/
https://apod.nasa.gov/apod/ap240818.html
https://science.nasa.gov/science-research/heliophysics/nasa-noaa-sun-reaches-maximum-phase-in-11-year-solar-cycle/
https://www.jpl.nasa.gov/nmp/st5/SCIENCE/cme.html
https://science.nasa.gov/earth/facts/
https://apod.nasa.gov/apod/fap/ap251117.html
#space #comets #astrophotography #photography #science #astronomy #nature #NASA #ESA #education #apod
 that is not only impressively intricate but takes some unusual turns. This long-duration composite image taken from Alfacar, Spain last month captured this inner Solar System ionic tumult. Comet Lemmon is now fading as it heads out away from the Earth and Sun and back into the outer Solar System.
Authors & editors: Robert Nemiroff (MTU) & Jerry Bonnell (UMCP)
NASA Official: Amber Straughn Specific rights apply.
NASA Web Privacy, Accessibility, Notices;
A service of: ASD at NASA / GSFC,
NASA Science Activation
& Michigan Tech. U.")
Alt...
2025 November 17
A starfield is shown above a mountain peak. Just above the mountain and extending up toward the upper right is a blue-tinted tail of a comet. The comet's head is just to the left of the peak.
Comet Lemmon's Wandering Tail
* Image Credit: Ignacio Fernández
Explanation:
What has happened to Comet Lemmon's tail? The answer is blowing in the wind — the wind from the Sun in this case. This continuous outflow of charged particles from the Sun has been quite variable of late, as the Sun emits bursts of energy, CMEs, that push out and deflect charged particles emitted by the comet itself. The result is a blue hued ion tail for Comet C/2025 A6 (Lemmon) that is not only impressively intricate but takes some unusual turns. This long-duration composite image taken from Alfacar, Spain last month captured this inner Solar System ionic tumult. Comet Lemmon is now fading as it heads out away from the Earth and Sun and back into the outer Solar System.
Authors & editors: Robert Nemiroff (MTU) & Jerry Bonnell (UMCP)
NASA Official: Amber Straughn Specific rights apply.
NASA Web Privacy, Accessibility, Notices;
A service of: ASD at NASA / GSFC,
NASA Science Activation
& Michigan Tech. U.
![[?]](https://cdn.toad.social/accounts/avatars/109/445/054/979/275/176/original/f4cd3985267c0654.jpg)

"I've watched that happen over and over and over again, including on 'our side' over the past dozen years as a lot of men learned a lot about gender politics as in how rape happens and who lies about it and how pervasive it is. Feminist activism in this period did a brilliant job in demolishing a lot of excuses, stereotypes, victim-blaming, and other misconceptions about rape that had been used to dismiss the reality and excuse the perpetrators."
"If there's one thing you should learn from the arc of a lot of news stories is that people do learn and change their minds. We've seen it very recently with opinions about Israel and Gaza, with attitudes toward immigration, and other important issues."
I like Rebecca Solnit's emphasis on optimism and the need for solidarity across boundary lines that might otherwise divide us on the liberal-progressive side of the ledger.
As a US Southerner, I find the optimism less easy to muster than people out West, whose historical experience is different from mine, might do. But I'm absolutely on board with Solnit's understanding of the need for soldarity and how to form it.
She writes:
The Great Crossing
(Saturn's rings on the edge)
This movie sequence captures Saturn's rings during a ring plane crossing from the Cassini spacecraft's point of view. The movie begins with a view of the sunlit side of the rings. As the spacecraft speeds from south to north, the rings appear to tilt downward and collapse to a thin plane, and then open again to reveal the un-illuminated side of the ring plane, where sunlight filters through only dimly. The movie consists of 34 images taken over the course of 12 hours as Cassini pierced the ring plane. Six moons careen through the field of view during the sequence. The first large one is Enceladus, whose slanted motion from the upper left to center right nicely illustrates the inclination of its orbit with respect to the rings. The second large one, seen in the second half of the movie, is Mimas, going from right to left.
Saturn's rings are about 175,000 miles (282,000 km) across, but only about 3,200 feet (~1 km) thick. If you had a model of Saturn that wasCRED a meter stick wide (3 feet), its rings would be about 10,000 times thinner than a razor blade! Saturn and its rings would just fit in the distance between Earth and the Moon.
Saturn's rings probably formed when objects like comets, asteroids, or even moons broke up in orbit around Saturn due to Saturn's very strong gravity. The pieces of these objects kept colliding with each other and broke into even smaller pieces. These pieces gradually spread around Saturn to form its rings. The rings are thought to be short-lived compared to the age of the Solar System, meaning that if we lived at a very different time, we may not have seen rings around Saturn.
Saturn's rings are made of billions of pieces of ice, dust and rocks. (more in ALT-text)
CREDIT
NASA Jet Propulsion Laboratory,
https://coolcosmos.ipac.caltech.edu/ask/108-How-large-are-Saturn-s-rings-
#space #saturn #astrophotography #photography #science #astronomy #physics #nature #NASA #ESA #education #apod
2025 November 16
Crossing Saturn's Ring Plane
* Image Credit: NASA, ESA, JPL, ISS, Cassini Imaging Team
https://www.nasa.gov/
https://www.esa.int/
https://www.jpl.nasa.gov/
http://ciclops.org/iss/iss.php
http://ciclops.org/
* Processing: Fernando Garcia Navarro
Explanation:
If this is Saturn, where are the rings? When Saturn's "appendages" disappeared in 1612, Galileo did not understand why. Later that century, it became understood that Saturn's unusual protrusions were rings and that when the Earth crosses the ring plane, the edge-on rings will appear to disappear. This is because Saturn's rings are confined to a plane many times thinner, in proportion, than a razor blade. In modern times, the robotic Cassini spacecraft that orbited Saturn frequently crossed Saturn's ring plane during its mission to Saturn, from 2004 to 2017. A series of plane crossing images from 2005 February was dug out of the vast online Cassini raw image archive by interested Spanish amateur Fernando Garcia Navarro. Pictured here, digitally cropped and set in representative colors, is the striking result. Saturn's thin ring plane appears in blue, bands and clouds in Saturn's upper atmosphere appear in gold. Details of Saturn's rings can be seen in high dark shadows. The moons Dione and Enceladus appear as bumps in the rings.
https://asterisk.apod.com/viewtopic.php?f=9&t=18340&p=230228#p230227
https://slate.com/technology/2005/06/saturns-thin-blue-line.html
https://coolcosmos.ipac.caltech.edu/ask/108-How-large-are-Saturn-s-rings-
https://solarsystem.nasa.gov/cassini-raw-images/
https://science.nasa.gov/mission/cassini/
https://science.nasa.gov/mission/cassini/spacecraft/cassini-orbiter/
https://science.nasa.gov/mission/cassini/spacecraft/cassini-orbiter/
https://science.nasa.gov/saturn/moons/dione/
https://science.gsfc.nasa.gov/attic/huygensgcms/Shistory.htm
https://en.wikipedia.org/wiki/Galileo_Galilei
https://apod.nasa.gov/apod/ap251116.html
#space #saturn #astrophotography #photography #science #astronomy #physics #nature #NASA #ESA #education #apod
 & Jerry Bonnell (UMCP)
NASA Official: Amber Straughn Specific rights apply.")
Alt...
2025 November 16
The planet Saturn is shown as an orange orb with bands. A blue line with bumps runs across the middle -- which is the rings seen sideways. The bumps are small moons.
Crossing Saturn's Ring Plane
* Image Credit: NASA, ESA, JPL, ISS, Cassini Imaging Team
* Processing: Fernando Garcia Navarro
Explanation:
If this is Saturn, where are the rings? When Saturn's "appendages" disappeared in 1612, Galileo did not understand why. Later that century, it became understood that Saturn's unusual protrusions were rings and that when the Earth crosses the ring plane, the edge-on rings will appear to disappear. This is because Saturn's rings are confined to a plane many times thinner, in proportion, than a razor blade. In modern times, the robotic Cassini spacecraft that orbited Saturn frequently crossed Saturn's ring plane during its mission to Saturn, from 2004 to 2017. A series of plane crossing images from 2005 February was dug out of the vast online Cassini raw image archive by interested Spanish amateur Fernando Garcia Navarro. Pictured here, digitally cropped and set in representative colors, is the striking result. Saturn's thin ring plane appears in blue, bands and clouds in Saturn's upper atmosphere appear in gold. Details of Saturn's rings can be seen in high dark shadows. The moons Dione and Enceladus appear as bumps in the rings.
Authors & editors: Robert Nemiroff (MTU) & Jerry Bonnell (UMCP)
NASA Official: Amber Straughn Specific rights apply.
![[?]](https://assets.oldbytes.space/assets.oldbytes.space/accounts/avatars/114/416/081/618/354/475/original/acde538508d5c5a6.jpg)
A free ebook on the history of computers in education in Europe.
https://www.degruyter.com/document/doi/10.1515/9783110780147/html
2025 November 14
Florida Northern Lights
* Image Credit & Copyright: Samil Cabrera
https://www.instagram.com/astronycc/
Explanation:
Northern lights have come to Florida skies. In fact, the brilliant streak of a Northern Taurid meteor flashes through the starry night sky above the beach in this sea and skyscape, captured from Shired Island, Florida on November 11. Meteors from the annual Northern Taurid meteor shower are expected this time of year. But the digital camera exposure also records the shimmering glow of aurora, a phenomenon more often seen from our fair planet's higher geographical latitudes. Also known as aurora borealis, these northern lights are part of recent, wide spread auroral activity caused by strong geomagnetic storms. In the last few days, stormy spaceweather has been triggered by multiple Earth impacting coronal mass ejections and intense solar activity.
https://spaceweathergallery2.com/indiv_upload.php?upload_id=228413
https://www.swpc.noaa.gov/news/g3-strong-geomagnetic-storming-continues-g4-severe-still-expected
https://earthsky.org/astronomy-essentials/taurid-meteors-all-you-need-to-know/
https://earthsky.org/sun/sun-news-activity-solar-flare-cme-aurora-updates/
https://apod.nasa.gov/apod/ap251114.html
#space #earth #aurora #astrophotography #photography #NASA #science #physics #nature #education #4sAur #apod
 & Jerry Bonnell (UMCP)
NASA Official: Amber Straughn Specific rights apply.
NASA Web Privacy, Accessibility, Notices;
A service of: ASD at NASA / GSFC,
NASA Science Activation
& Michigan Tech. U.")
Alt...
2025 November 14
Florida Northern Lights
* Image Credit & Copyright: Samil Cabrera
Explanation:
Northern lights have come to Florida skies. In fact, the brilliant streak of a Northern Taurid meteor flashes through the starry night sky above the beach in this sea and skyscape, captured from Shired Island, Florida on November 11. Meteors from the annual Northern Taurid meteor shower are expected this time of year. But the digital camera exposure also records the shimmering glow of aurora, a phenomenon more often seen from our fair planet's higher geographical latitudes. Also known as aurora borealis, these northern lights are part of recent, wide spread auroral activity caused by strong geomagnetic storms. In the last few days, stormy spaceweather has been triggered by multiple Earth impacting coronal mass ejections and intense solar activity.
Authors & editors: Robert Nemiroff (MTU) & Jerry Bonnell (UMCP)
NASA Official: Amber Straughn Specific rights apply.
NASA Web Privacy, Accessibility, Notices;
A service of: ASD at NASA / GSFC,
NASA Science Activation
& Michigan Tech. U.
2011 March 25
Auroral Substorm over Yellowknife
* Image Credit & Copyright: Kwon, O Chul
https://twanight.org/profile/kwon-o-chul/
Explanation:
Intense auroral activity flooded the night with shimmering colors on February 24, captured here from a lodge near the city of Yellowknife in northern Canada. The stunning sequence (left to right) of three all-sky exposures, taken at 30 second intervals, shows rapid changes in dancing curtains of northern lights against a starry background. What makes the northern lights dance? Measurements by NASA's fleet of THEMIS spacecraft indicate that these explosions of auroral activity are driven by sudden releases of energy in the Earth's magnetosphere called magnetic reconnection events. The reconnection events release energy when magnetic field lines snap like rubber bands, driving charged particles into the upper atmosphere. Stretching into space, these reconnection events occur in the magnetosphere on the Earth's night side at a distance about 1/3 of the way to the Moon.
https://apod.nasa.gov/apod/ap110325.html
#space #earth #aurora #astrophotography #photography #NASA #science #physics #nature #education #4sAur

Explanation:
Intense auroral activity flooded the night with shimmering colors on February 24, captured here from a lodge near the city of Yellowknife in northern Canada. The stunning sequence (left to right) of three all-sky exposures, taken at 30 second intervals, shows rapid changes in dancing curtains of northern lights against a starry background. What makes the northern lights dance? Measurements by NASA's fleet of THEMIS spacecraft indicate that these explosions of auroral activity are driven by sudden releases of energy in the Earth's magnetosphere called magnetic reconnection events. The reconnection events release energy when magnetic field lines snap like rubber bands, driving charged particles into the upper atmosphere. Stretching into space, these reconnection events occur in the magnetosphere on the Earth's night side at a distance about 1/3 of the way to the Moon.
Authors & editors: Robert Nemiroff (MTU) & Jerry Bonnell (UMCP)
NASA Official: Phillip Newman Specific rights apply.
NASA Web Privacy Policy and Important Notices
A service of: ASD at NASA / GSFC
& Michigan Tech. U.")
Alt...
2011 March 25
Auroral Substorm over Yellowknife
* Image Credit & Copyright: Kwon, O Chul (TWAN)
Explanation:
Intense auroral activity flooded the night with shimmering colors on February 24, captured here from a lodge near the city of Yellowknife in northern Canada. The stunning sequence (left to right) of three all-sky exposures, taken at 30 second intervals, shows rapid changes in dancing curtains of northern lights against a starry background. What makes the northern lights dance? Measurements by NASA's fleet of THEMIS spacecraft indicate that these explosions of auroral activity are driven by sudden releases of energy in the Earth's magnetosphere called magnetic reconnection events. The reconnection events release energy when magnetic field lines snap like rubber bands, driving charged particles into the upper atmosphere. Stretching into space, these reconnection events occur in the magnetosphere on the Earth's night side at a distance about 1/3 of the way to the Moon.
Authors & editors: Robert Nemiroff (MTU) & Jerry Bonnell (UMCP)
NASA Official: Phillip Newman Specific rights apply.
NASA Web Privacy Policy and Important Notices
A service of: ASD at NASA / GSFC
& Michigan Tech. U.